
Most people are not political or generational stereotypes
A famous logical fallacy explains why we caricaturize Republicans and Zoomers.

We live in polarizing times. Obviously.
An unfortunate consequence, though, of this very real polarization in the beliefs and behaviors of different social groups is a tendency to caricaturize members of those groups.
Perhaps, nowhere is this tendency more visible than in media headlines about Gen Z, a typical formula being a string of adjectives as a blanket description of all Zoomers.

Sometimes headlines do this even for the culturally obsolete Millennials:
But a group that’s particularly cartoonified is Republican voters. To be sure, news stories about Republicans are much better in 2023 than they were in 2015 and tend to be cognizant of the diverse, often divided factions within the party. But still, headlines for polls — and the stories themselves if you don’t carefully interpret them — can sometimes give the impression of a unified, far-right voter base positioned against the Democrats on every possible issue.
I come to you today armed with real survey data to show you exactly how these inferences are misleading. “Believe the data” or not, these ideas are also just logical fallacies.
Specifically, we’re going to look at the public opinion portraits of different American political and generational groups from the 2020 Cooperative Election Study (CES) run by Harvard University, a survey of more than 60,000 Americans on a range of issues taken before the 2020 elections.
Counting political stereotypes in polls
First, I tallied up how people answer relevant political attitudes questions on the CES. I then took it a step further and counted how often respondents’ positions align with the majority opinion for other respondents in their party. If Democrats or Republicans are really lock-step with their peers on every political opinion, then most people should score an A+ on this ‘party line report card’.
In fact, we something a bit different:
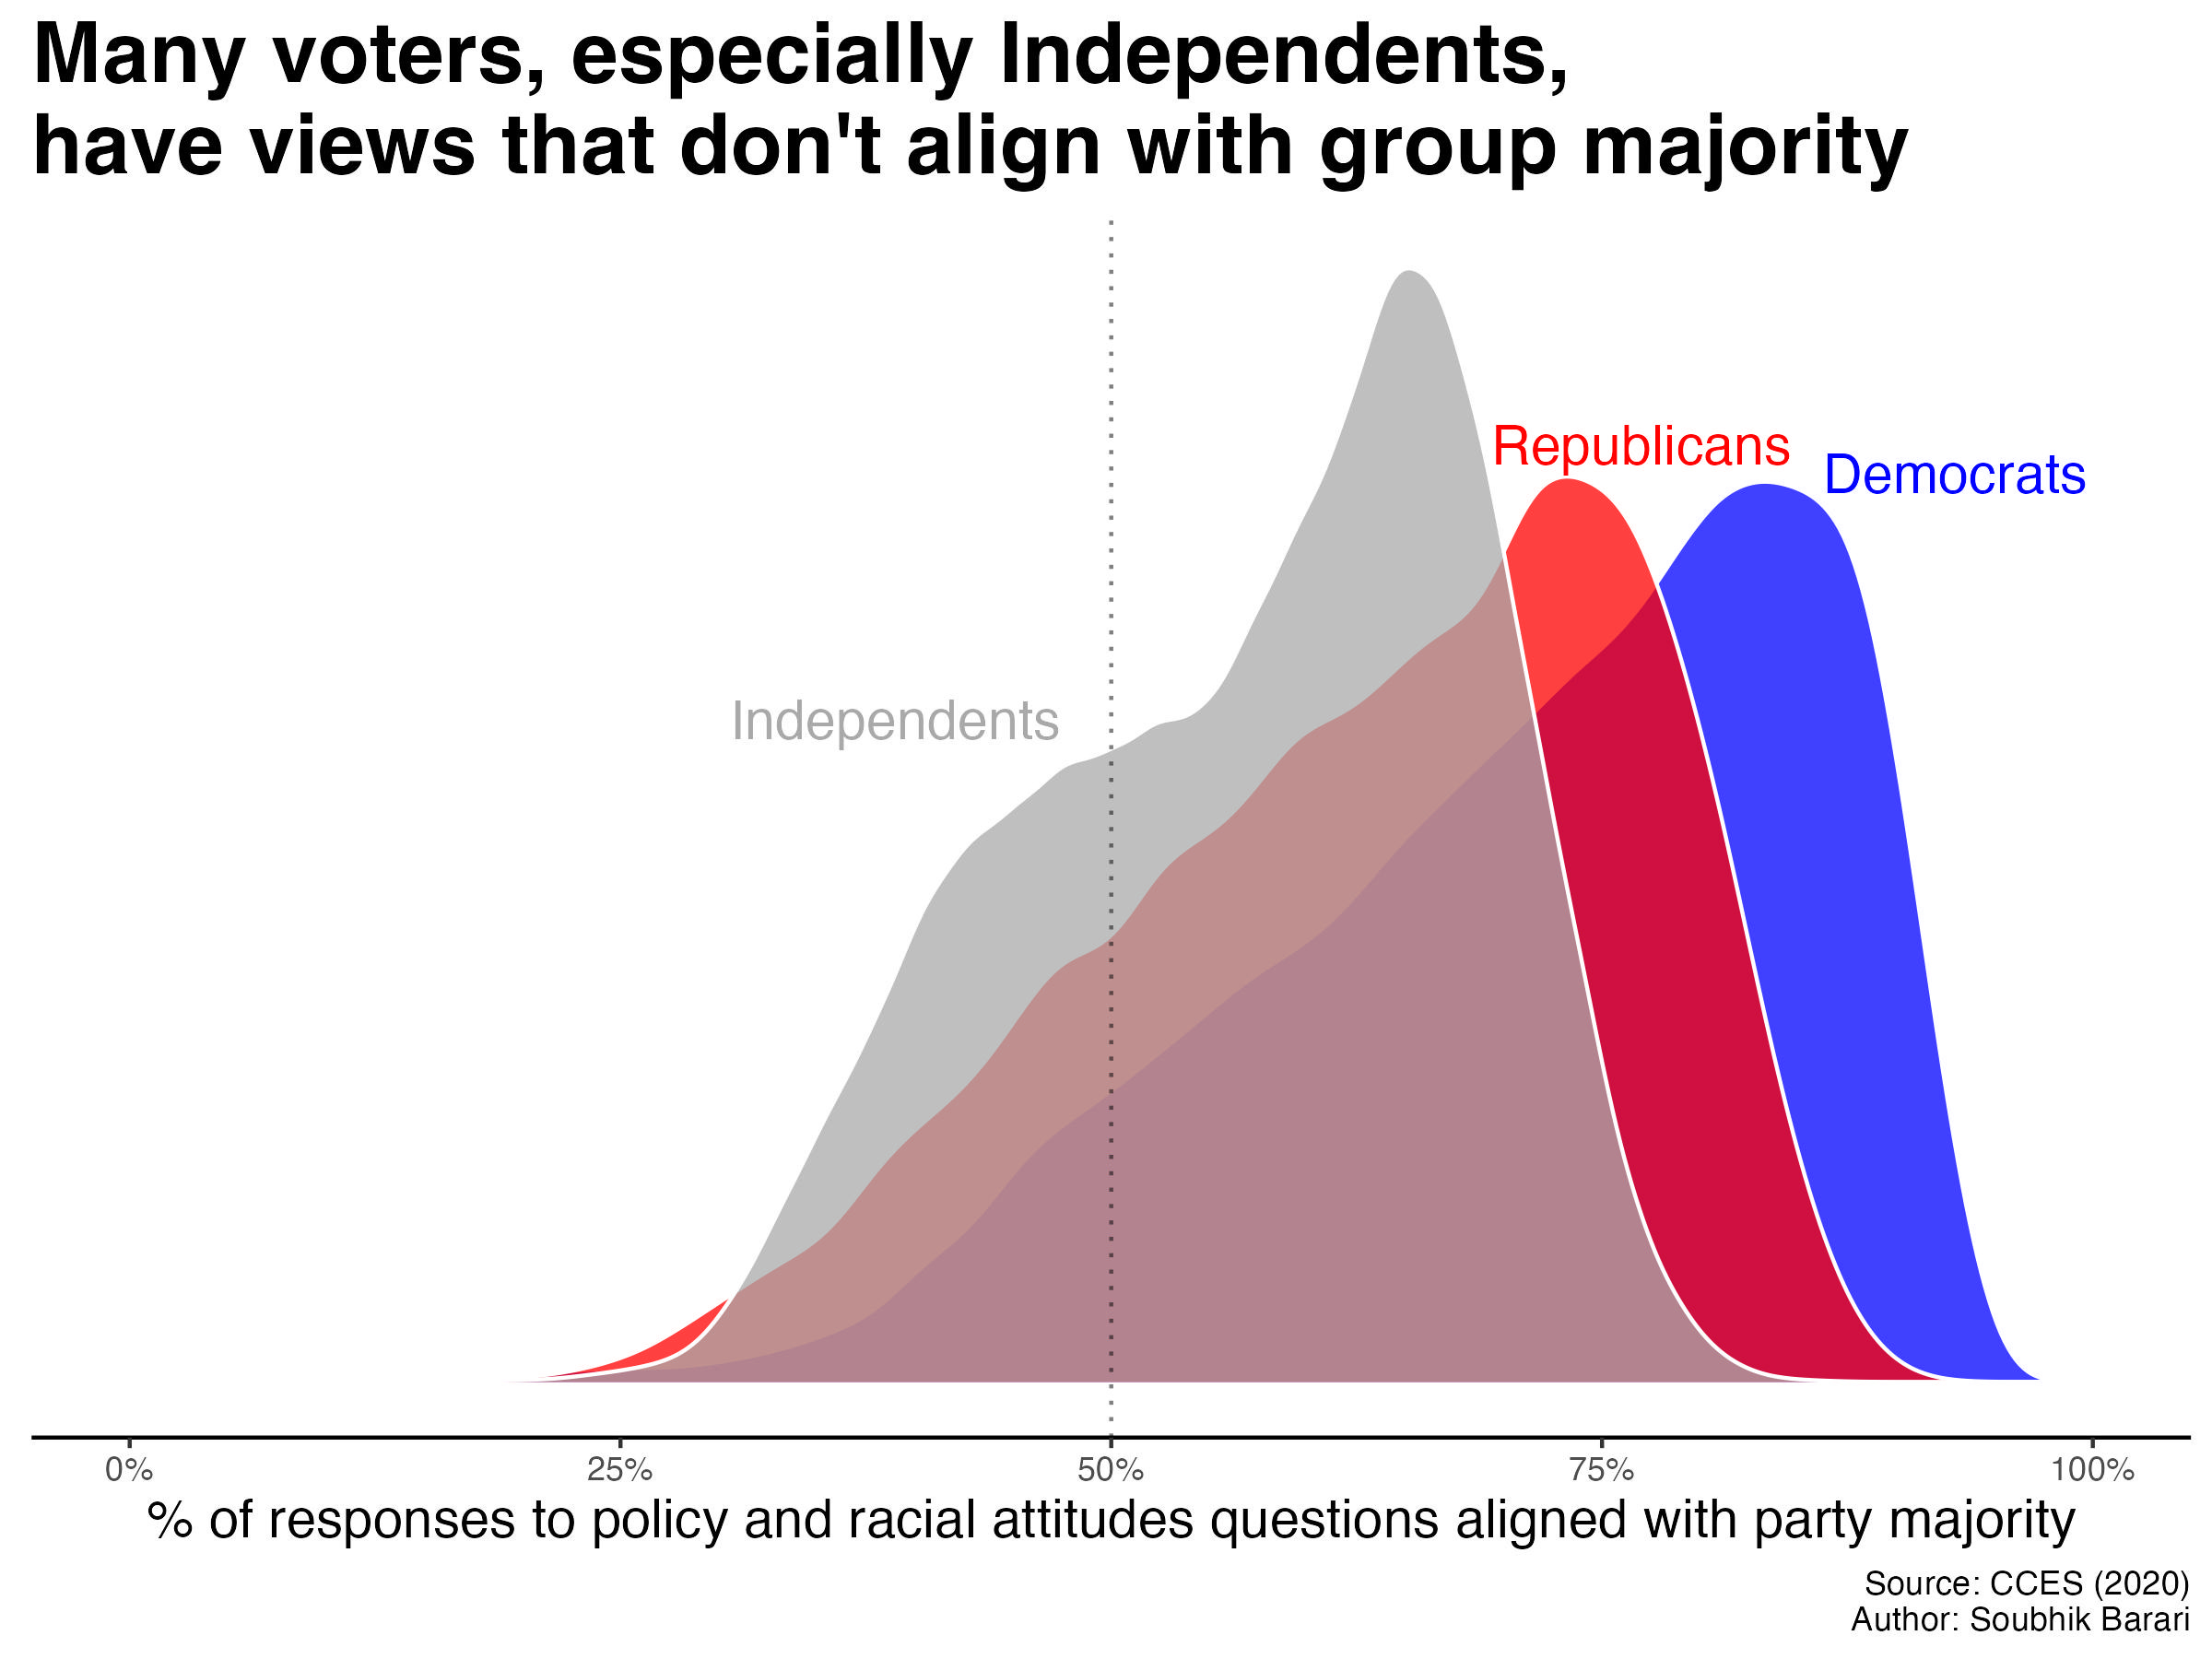
Some 8% of Democrats, 16% of Republicans, and (unsurprisingly) 25% of Independents held non-majority opinions on half or more of the political items they were asked. Those are sizable numbers, enough to swing any competitive election.
Below is another way to look at this histogram: a view of how many members in each party (shown on the vertical axis) agree with at least _% of their peers’ opinions.
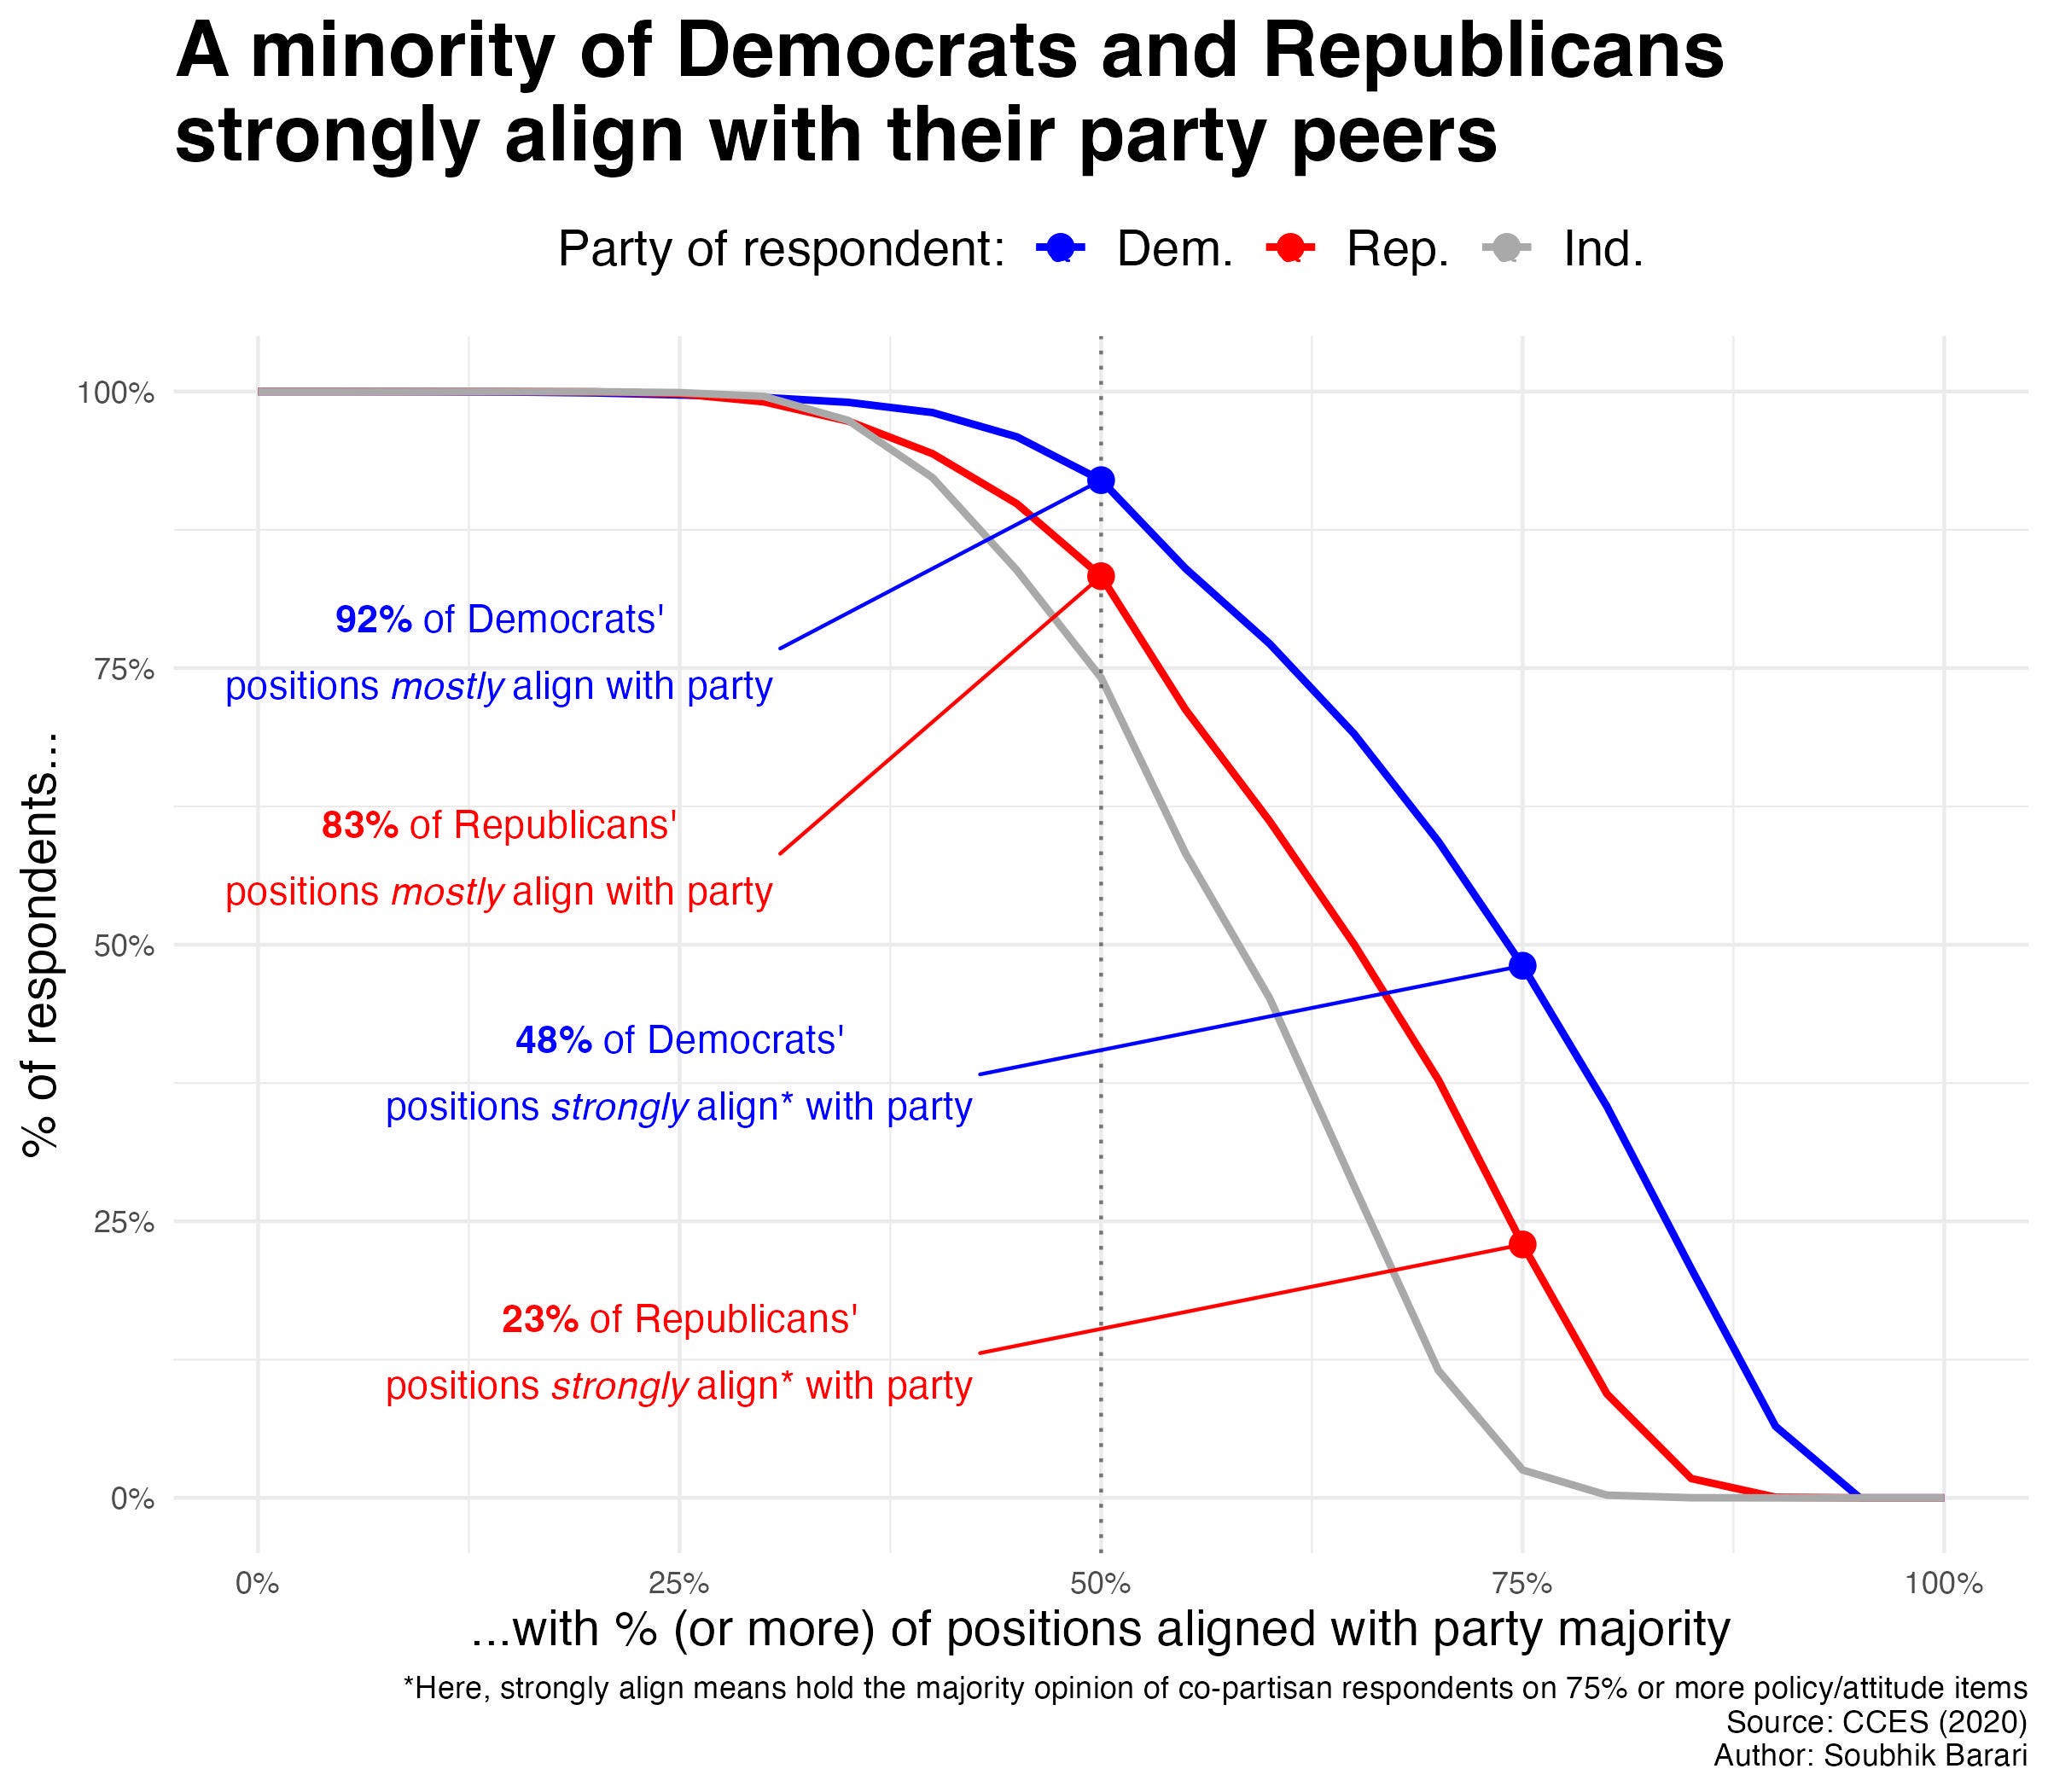
Think of this graph like standardized test scores where grades are on the vertical axis and the cumulative number achieving that grade or higher are on the horizontal axis. You should notice that barely half of Democrats get a passing C grade or higher, and less than a quarter of Republicans get the same.
But most strikingly, you should notice that literally zero respondents in each party hold all of the majority opinions in their peer group. That’s right: not a single “perfect” Democrat, Republican, or Independent exists in this survey.
The drop-off in alignment for Republicans at every possible grade compared to Democrats is especially interesting. Let’s line up the specific political positions that respondents gave on the survey from most popular to least popular and see how much responses overlap. The result is as follows (get your magnifying glasses out):
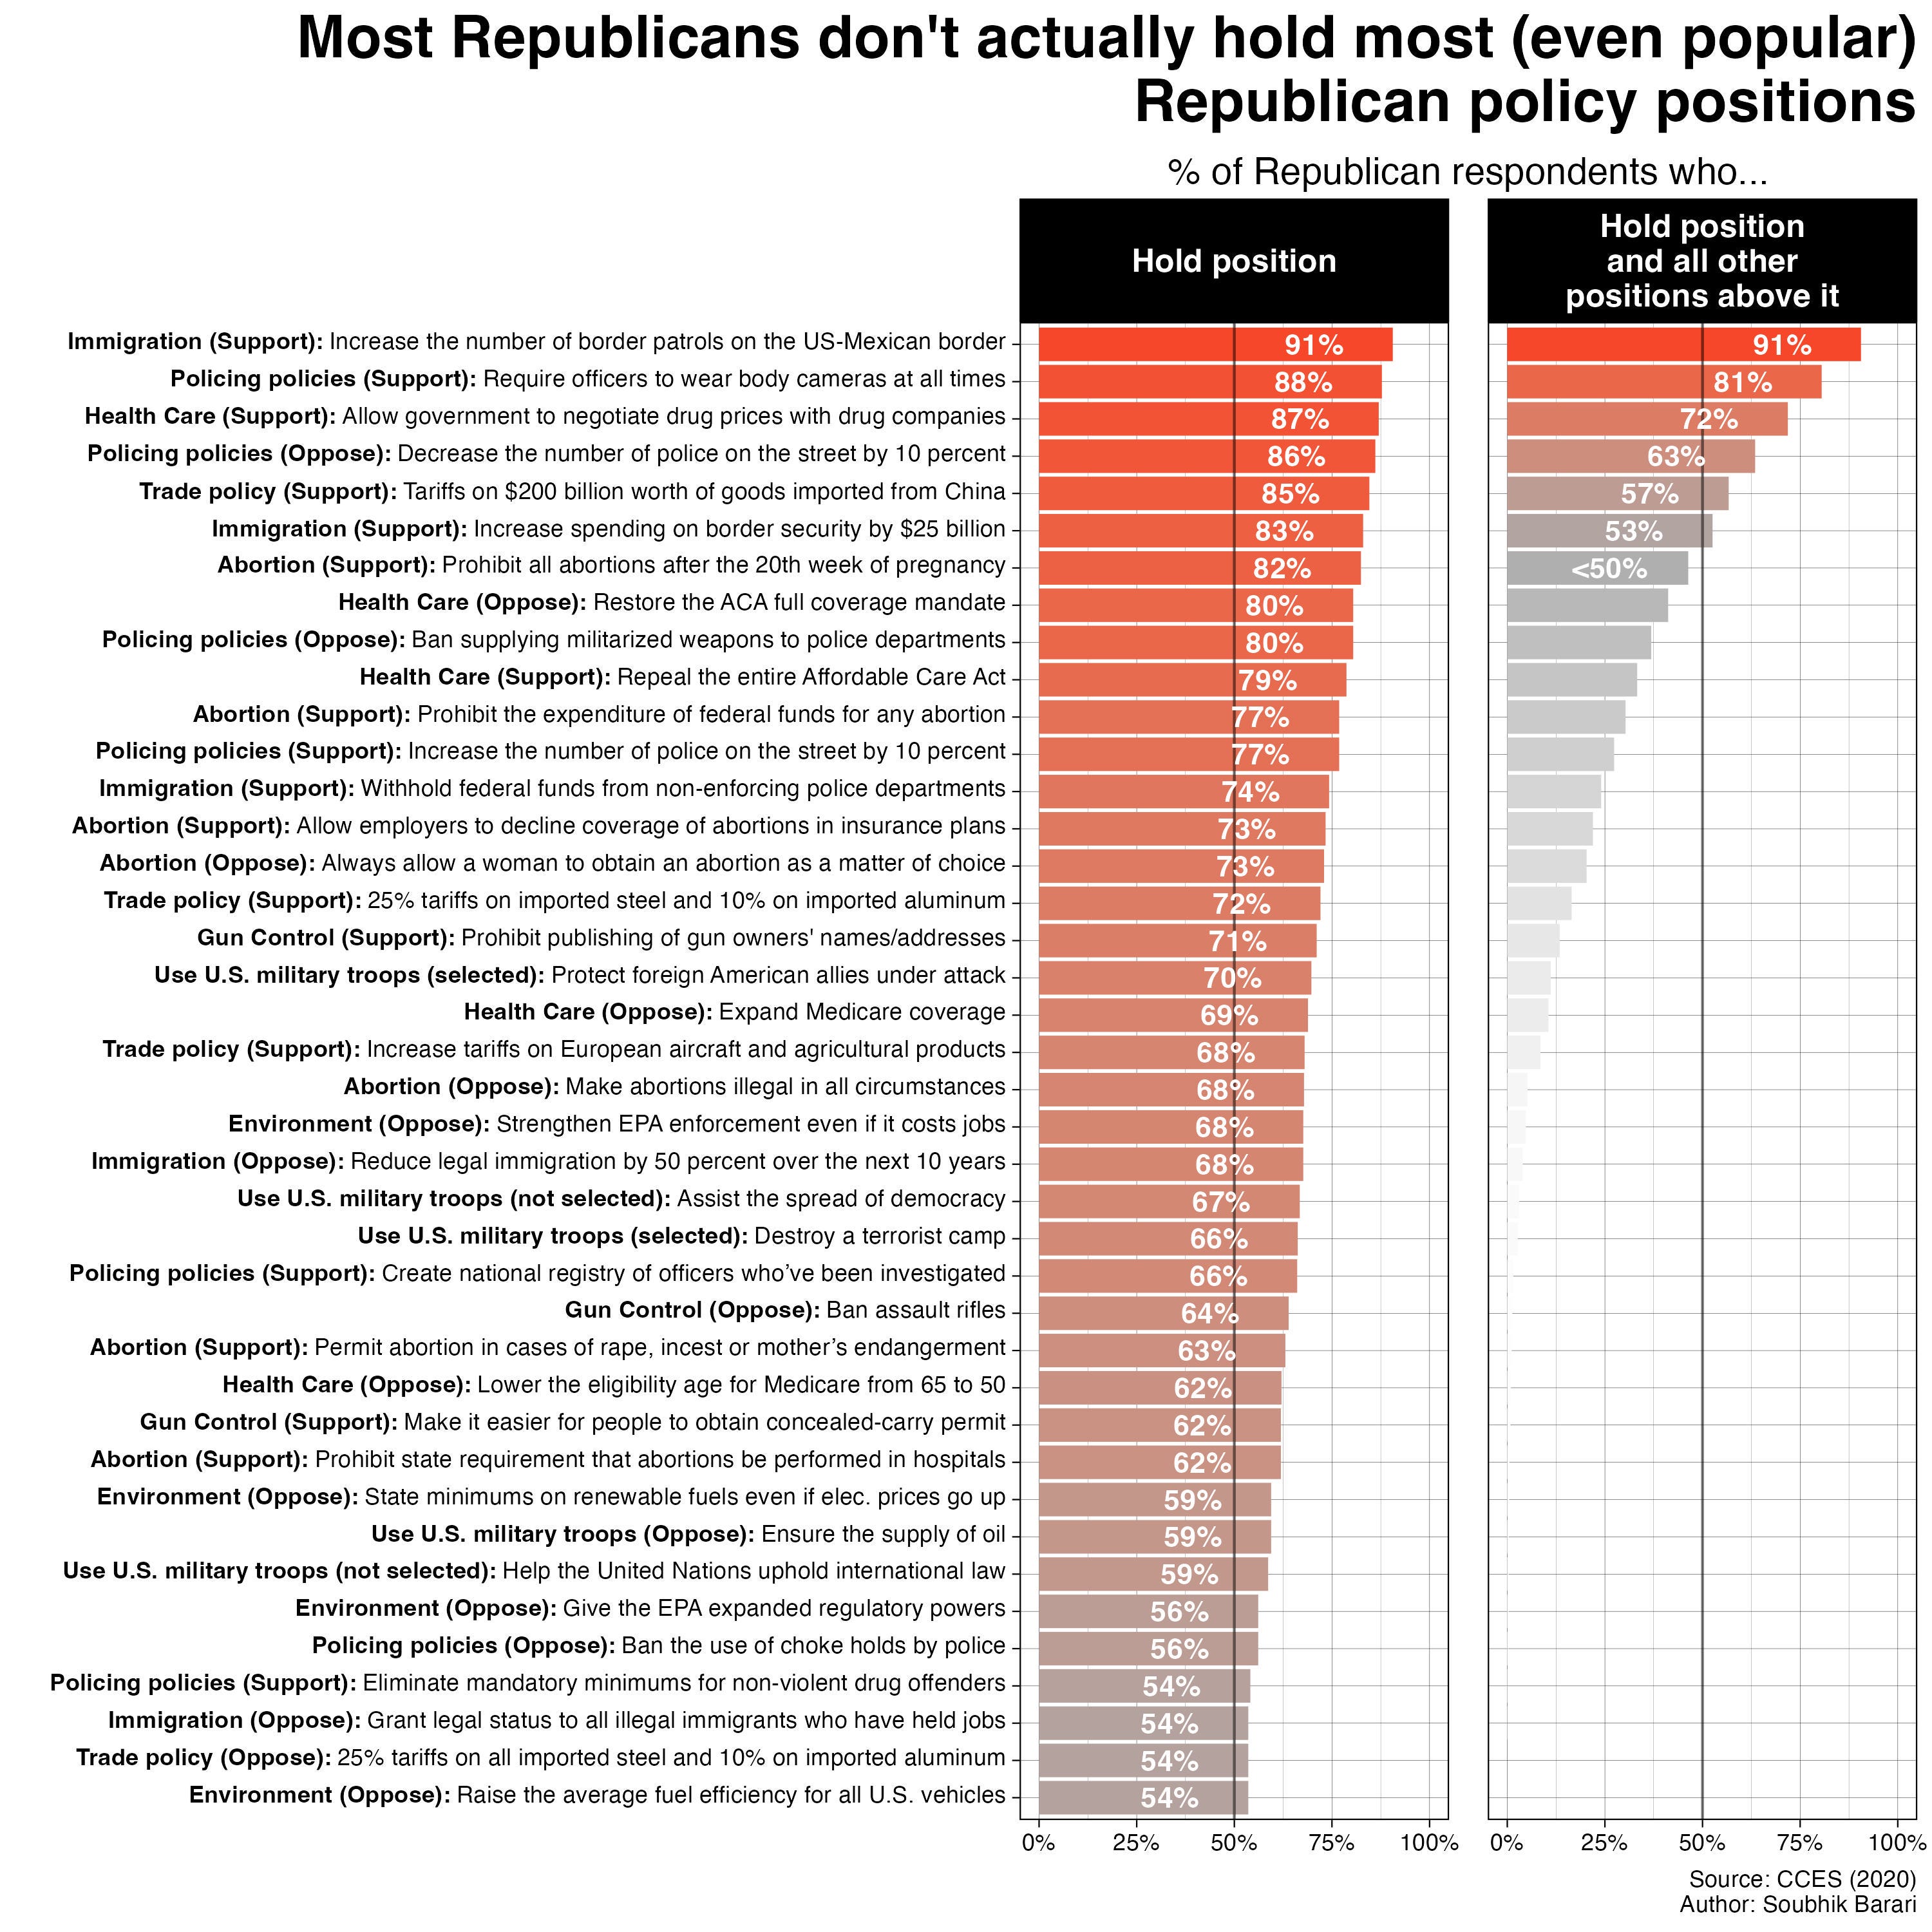
All the way at the top, the most popular position among Republican respondents — the one with the biggest majority at 91% — is support for increased border security on the US-Mexico border. 81% of respondents support that and the next most popular opinion of requiring officer body cams (surprising for Republicans, yes, but George Floyd’s murder in 2020 was a unique activating event). As we keep zooming out, the opinion majority shrinks and shrinks: 72% of Republicans support those two things and drug-price negotiation, 63% support those three and the next majority opinion, 57% support those four and the next … until we get to the seventh item concerning abortion bans where a majority no longer supports that and all of the other most popular Republican items. And that’s seven out of forty Republican positions.
To make things even simpler, we can arrange our survey Republicans in concentric circles like so:
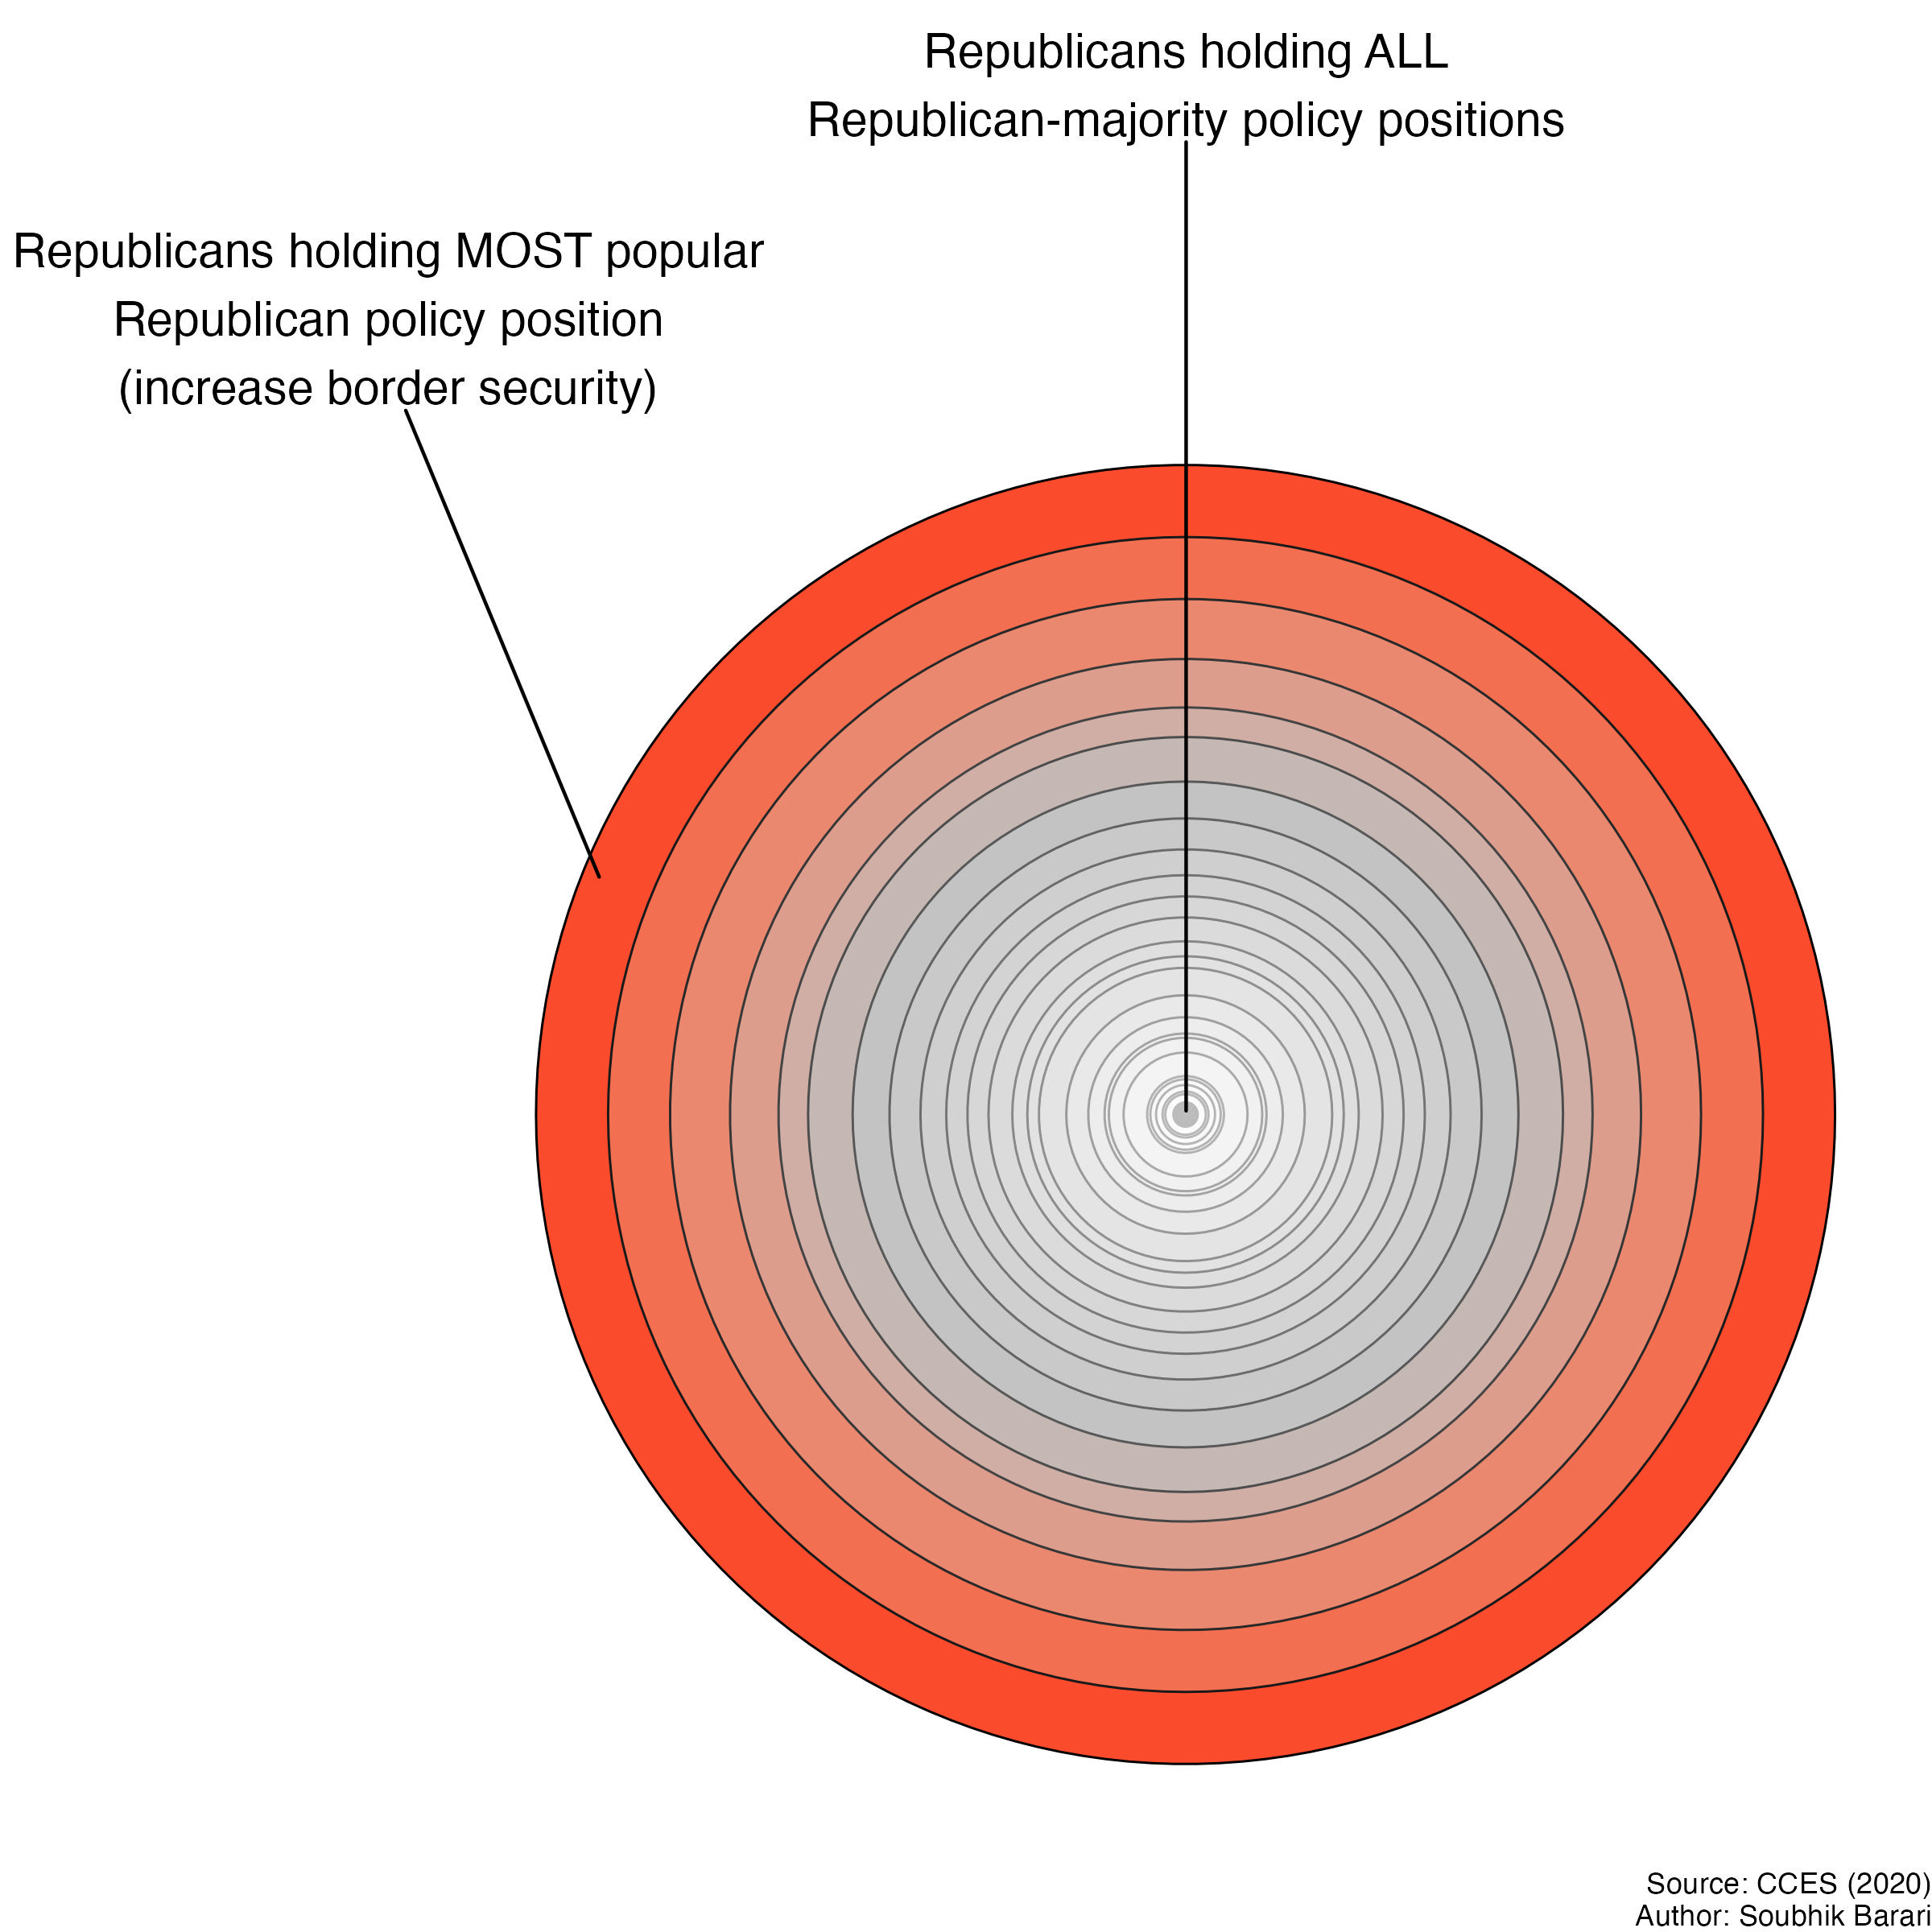
Although the saying goes that “Democrats fall in love, Republicans fall in line,” this diagram shows the inner-most core of Republicans in our sample who are most “in line” is pretty much non-existent.
What about the Zoomers?
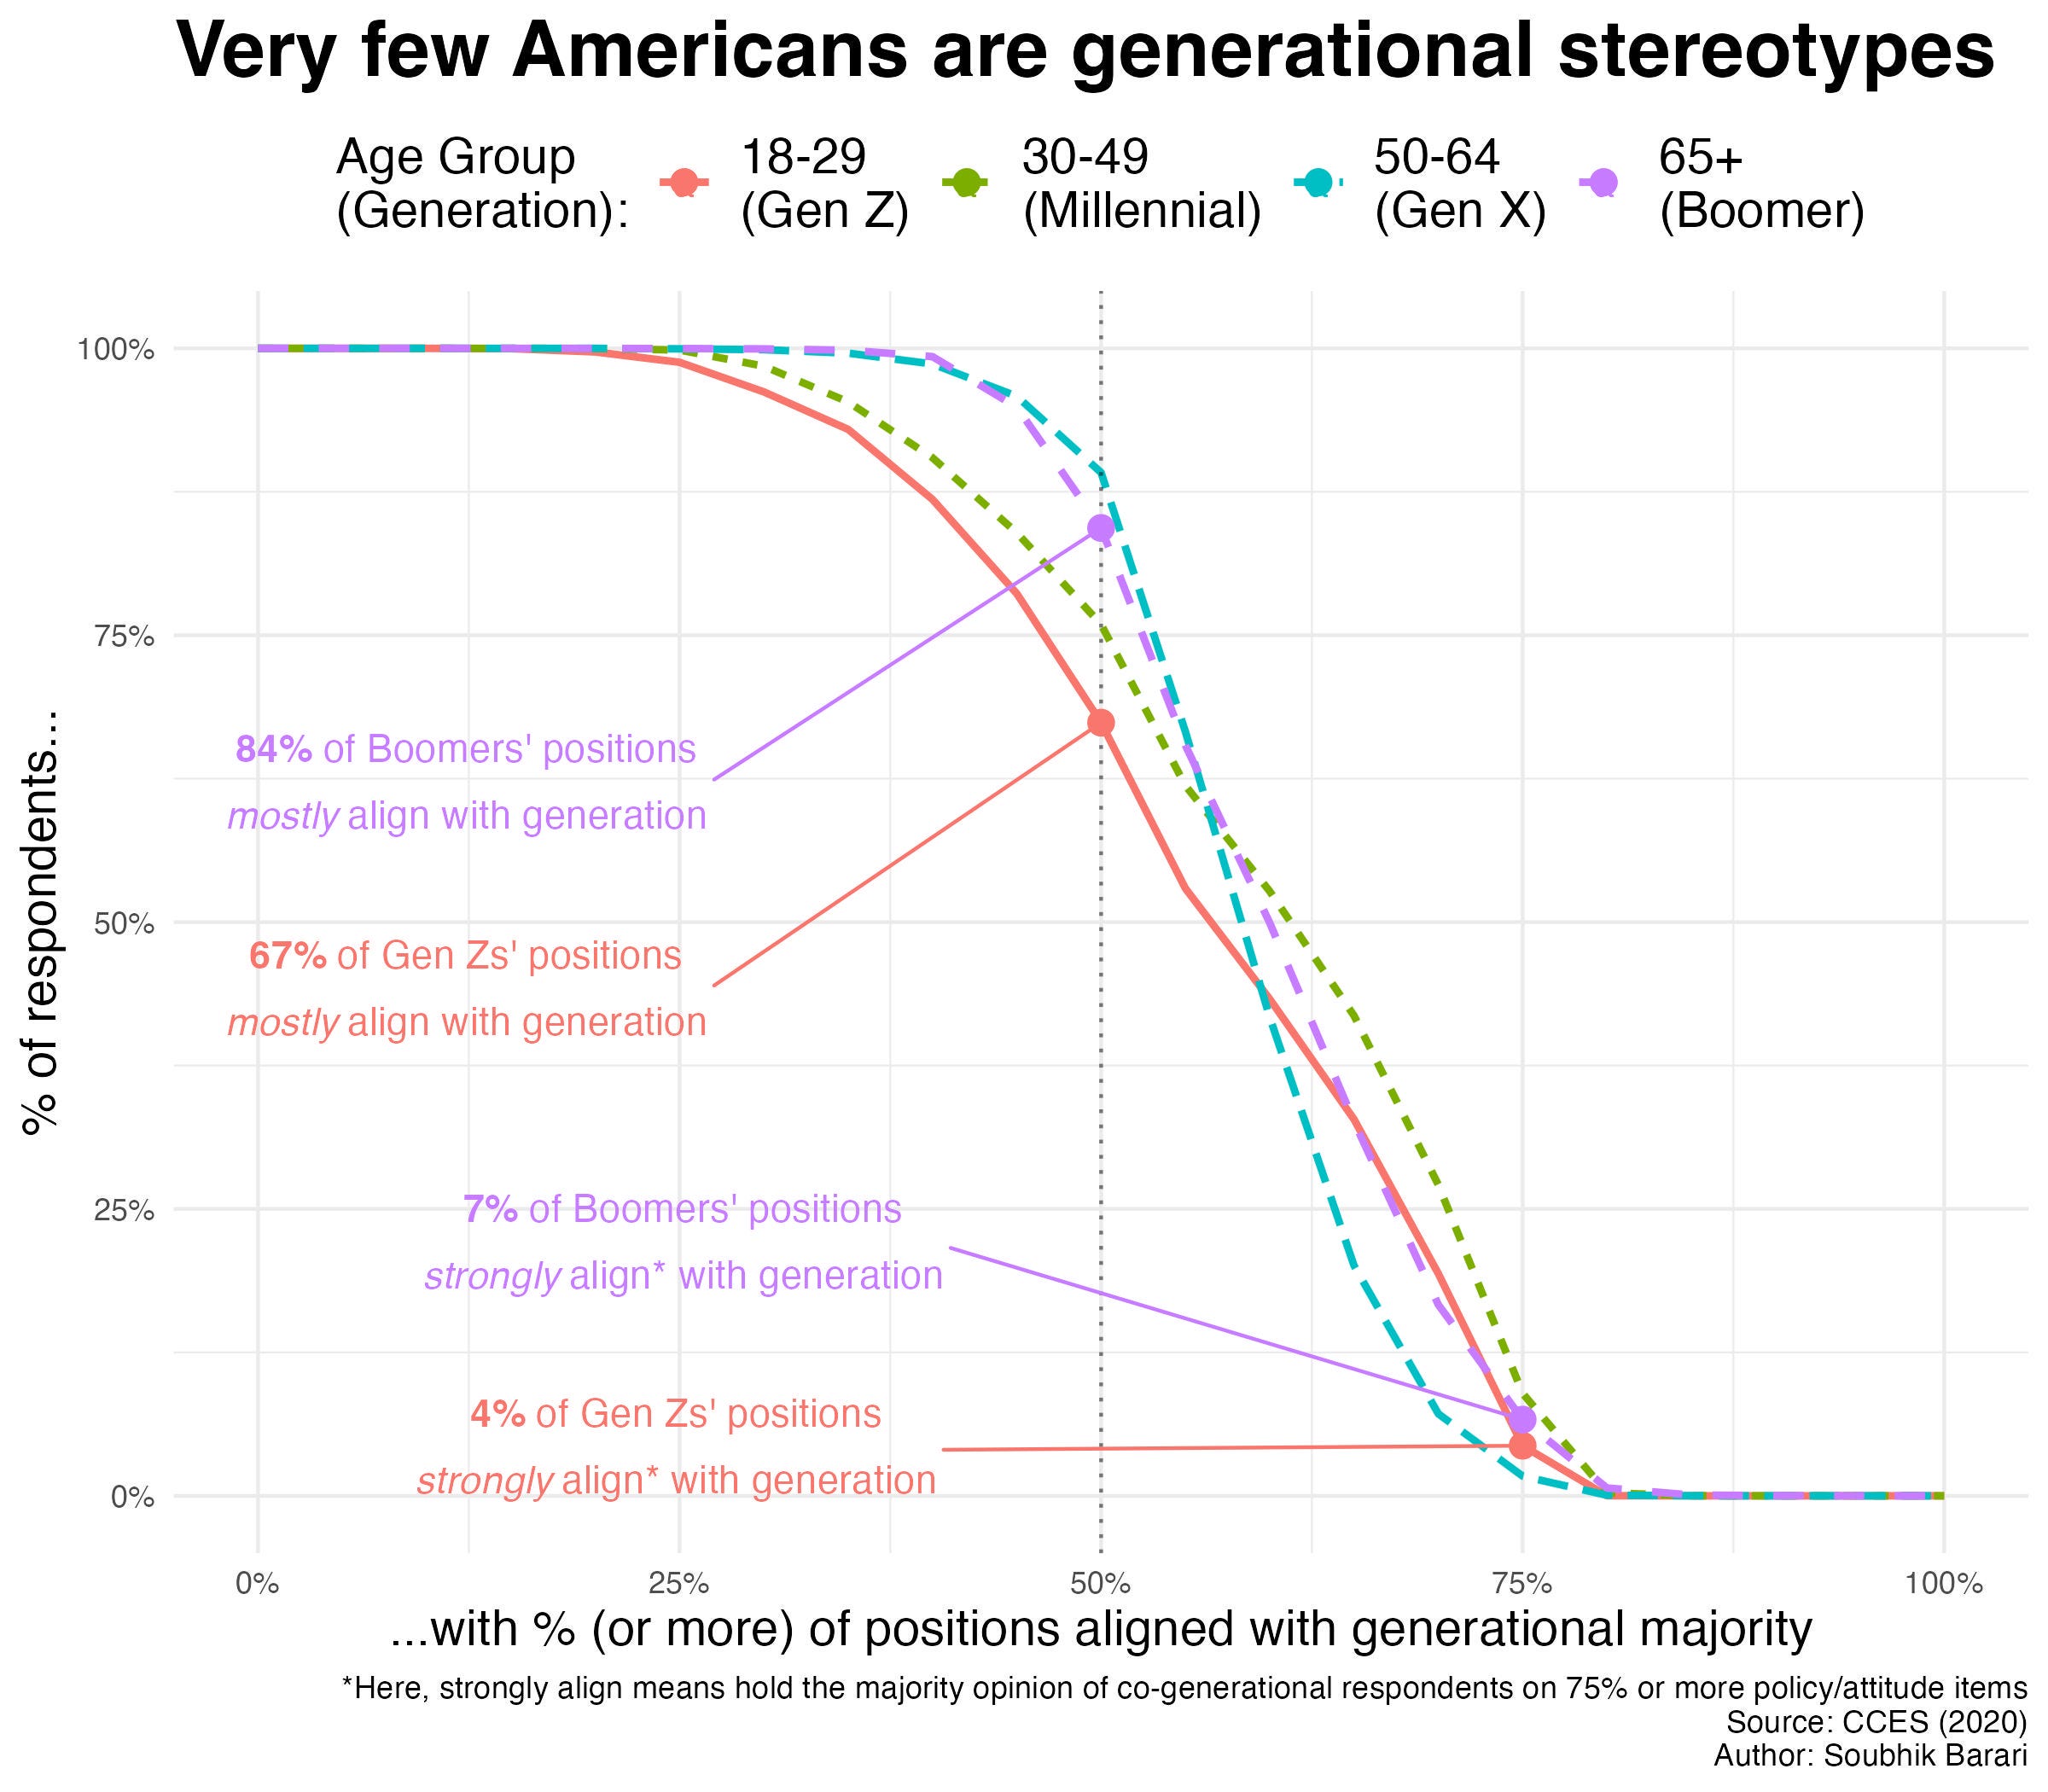
We can repeat this exercise by swapping out party labels for generational labels.1 The political disunity here is even more apparent — nearly all Zoomers and Boomers disagree on at least 1 out of 4 of political items.
Here are those specific positions and their cumulative overlaps for Gen Z respondents. We can see just how sharply the opinion group majority turns into a minority as we expand the definition of that opinion group.
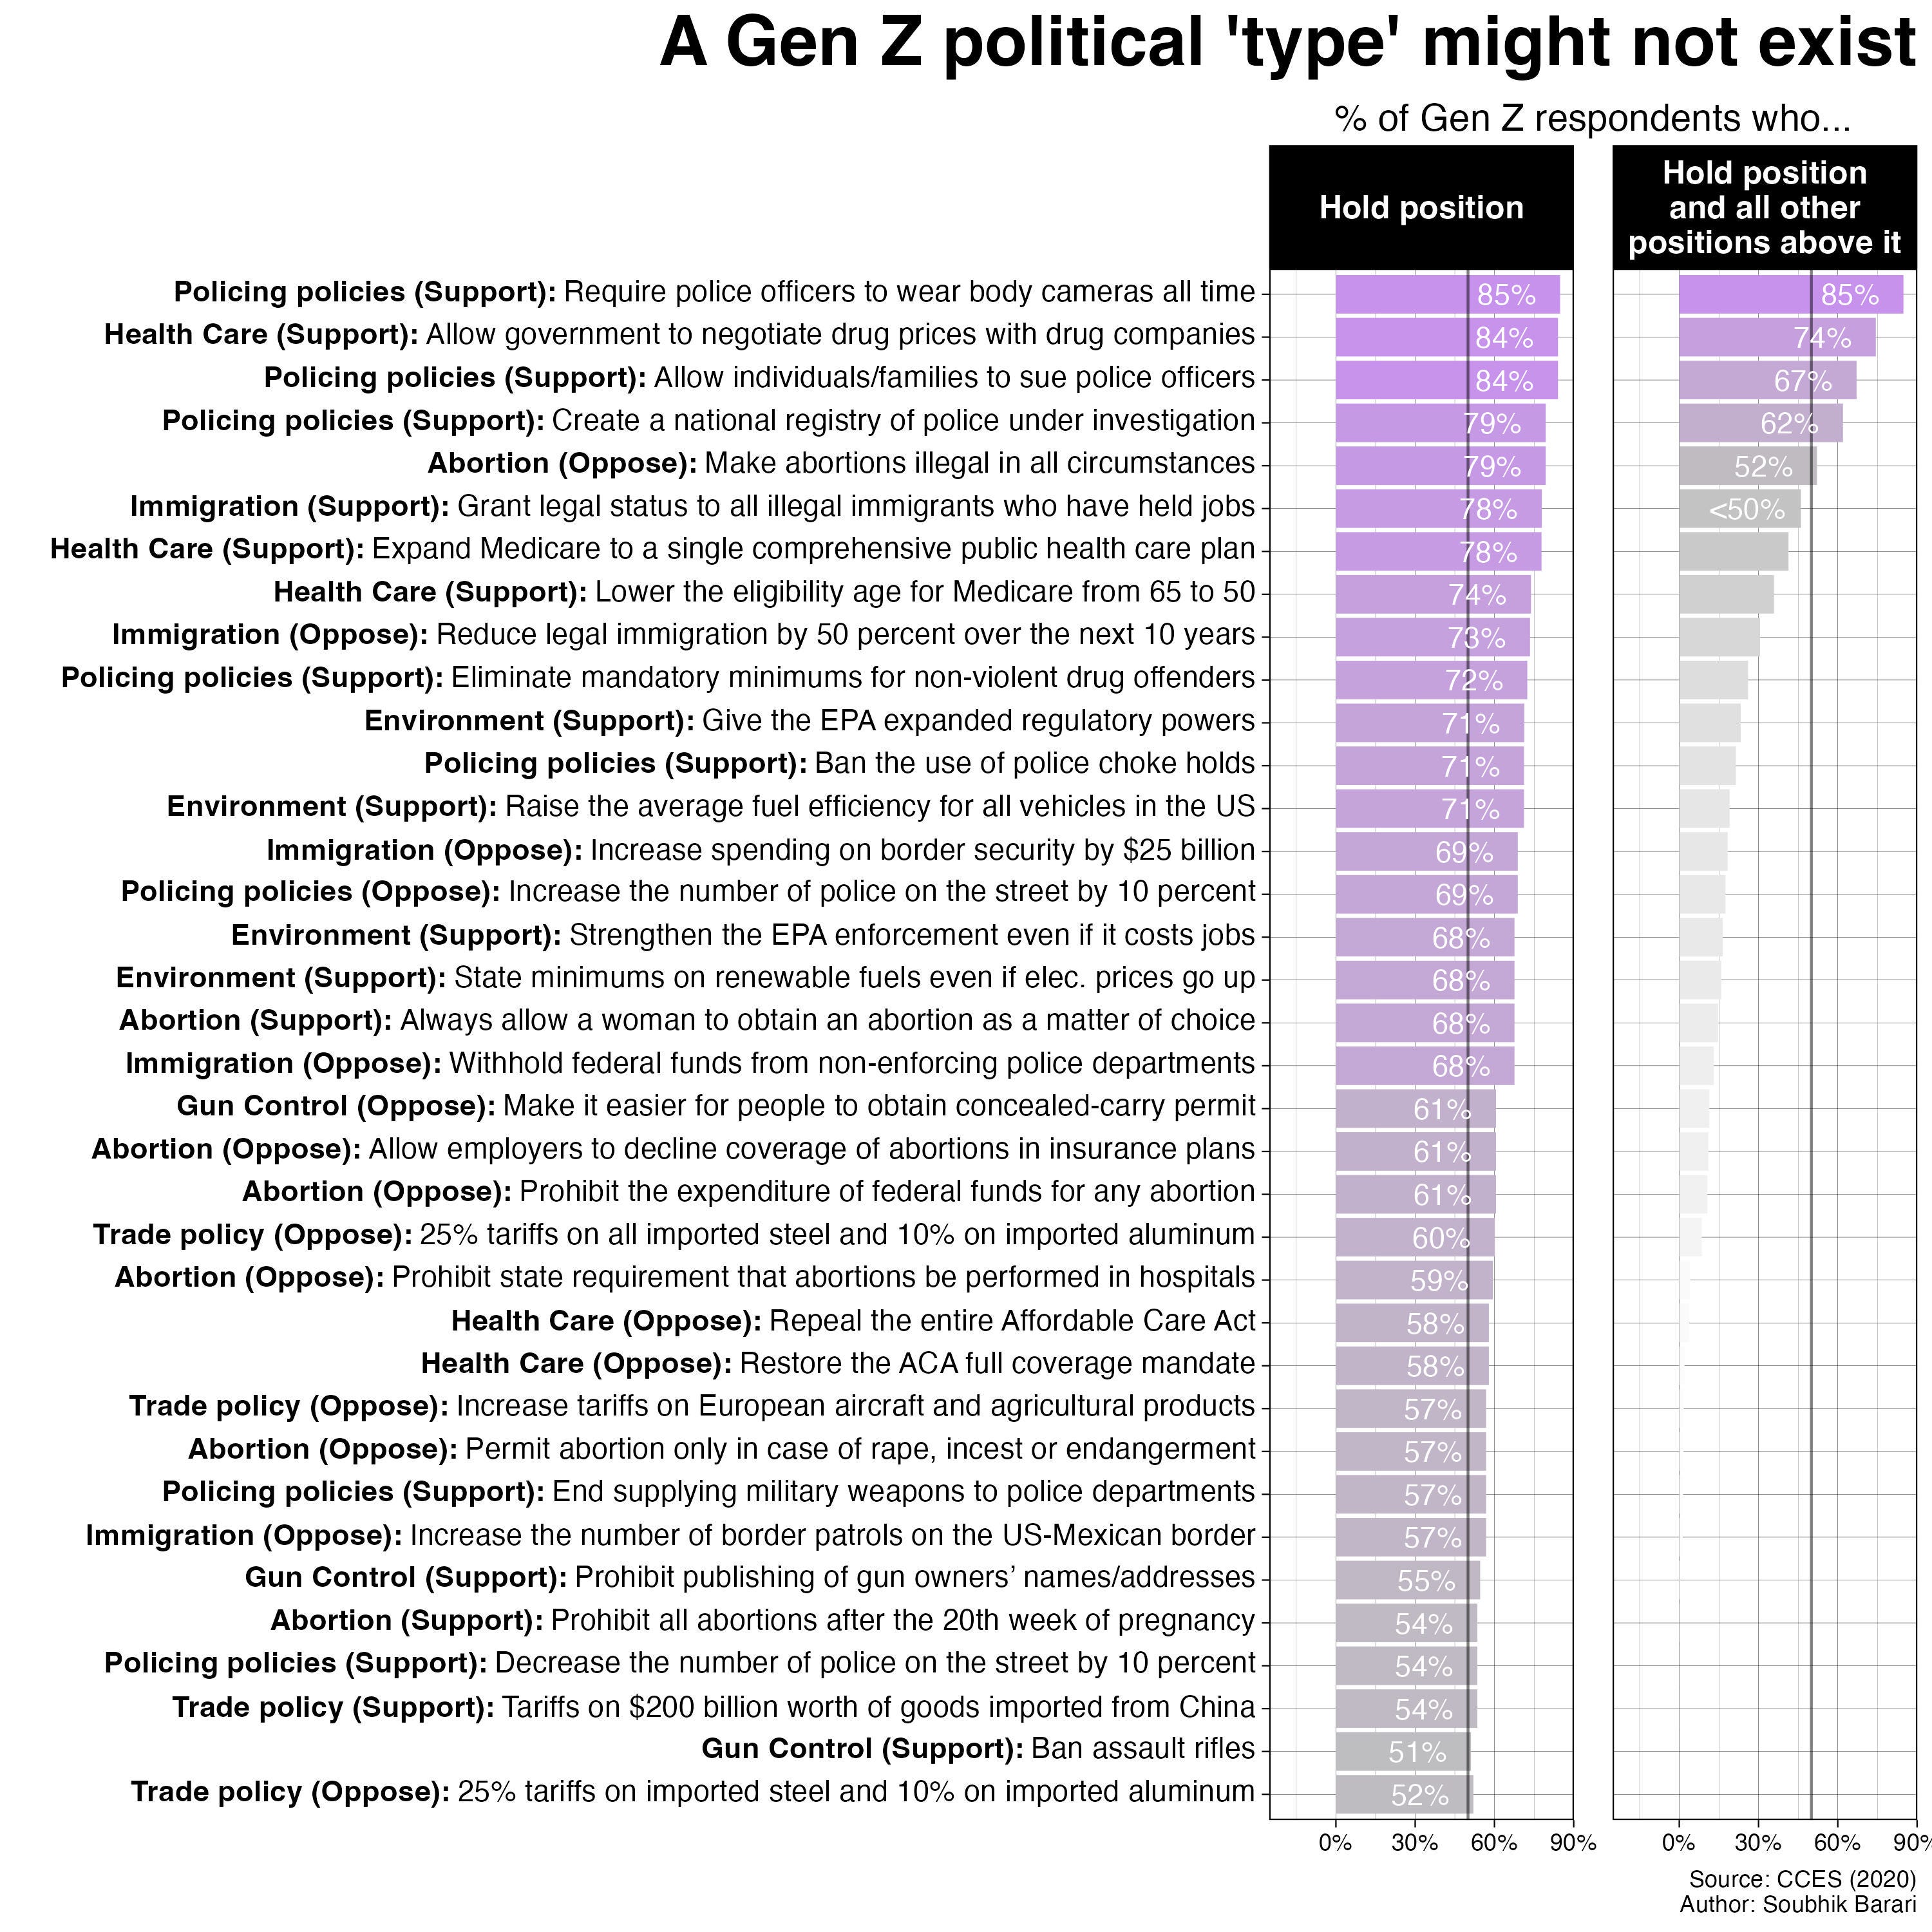
It shouldn’t surprise you that most people between the ages of 18 and 29 support police accountability, health care reform, and basic abortion rights.
However, it should surprise you how slim that majority is (only 52%), and it should really surprise you that when immigration and climate change — at least equally important issues of contemporary American politics as the other three — are put on the table, less than 30% of Zoomers support the whole package.
What does this mean and why should we care?
The lesson here is that even when a bunch of attitudes within a group are highly correlated with each other — as they usually are in the current era of political polarization — there’s nearly no one who holds all of those beliefs at the same time2.
The psychological tendency to infer the latter from the former is known as the conjunction fallacy or, more famously, the Linda Problem. Amos Tversky and Daniel Kahneman cleverly demonstrated this fallacy in an experiment where participants were given the following description of a woman named Linda:
Linda is 31 years old, single, outspoken, and very bright. She majored in philosophy. As a student, she was deeply concerned with issues of discrimination and social justice, and also participated in anti-nuclear demonstrations.
and then posed the question:
Which is more probable?
Linda is a bank teller.
Linda is a bank teller and is active in the feminist movement.
The vast majority of participants chose option 2, even though this is impossible: the probability of two events happening together (or in conjunction) is always less than or equal to the probability of either one occurring itself. Yes, even if the events are highly correlated!
In our version of the Linda problem, the description we are given is Linda’s age cohort or party affiliation and the two options we must evaluate are whether they hold just one popular characteristic typified by that group or whether they hold all of them. When we — voters, journalists, pollsters, news consumers — either explicitly or implicitly choose the latter, we are at best obtusely over-ascribing someone’s worldview to their group status. Although I haven’t shown you these results by race, black voters are perhaps the most salient victim of the conjunction fallacy, despite often bundling together socially conservative and economically liberal opinions. The relatively slim majorities or outright minorities of popular issue coalitions may also explain why split-ticket voting persists even in a time when voters are otherwise cleanly sorted into the two parties. This reductiveness papers over just how much political contestation there remains over these groups.
At worst, when conjunction fallacies occur at the elite level, they can bias how political and news leaders perceive the public, misinforming them on the kinds of policy packages and media narratives that are actually popular.
So, you know, don’t make political conjunction fallacies.
Data and code to replicate the findings in this article (along with a few other goodies) can be found here.
Generational lines are somewhat vibes-based and social science research is moving beyond the usage of generational labels .. but shared generational identity is a real, serious thing.
Part of this might be an artifact of inattentive or inconsistent survey respondents (asked again, maybe these people would completely parrot the party line on these items). But this also happens outside of surveys.