
The most important counties in the 2024 election
Which little dots on the map you should be paying attention to.

Elections are decided by what happens in just a few swing states. And the outcomes in those swing states depend on what happens, in some cases, just a few counties.
In other words: tonight, after the networks receive the vote totals in just a few counties, it is possible we will know who will become President of the United States.
Counties, and not just states, are a level of geography you should be paying attention to: this is the level at which votes are counted, reported to state and national organizations — and these days, disputed, investigated, and protested by voters and campaign officials alike.
Which counties will matter in 2024? Here is my take on the so-called ‘bellwether counties’. For news organizations covering the unfolding election and for the anxious viewers at home trying to make sense of it all, there are two dimensions that matter - competition or how ‘in play’ that county is between the two parties and importance or how many votes the county has to contribute to each candidate in that state. (For a campaign strategist, there is a much more complex calculus involving jointly maximizing turnout of the base and persuasion of the undecided … that game has already been played, so let’s set that aside).
Here are some graphs of counties in each of the seven battleground states along these two dimensions based on their outcomes in 2020. For simplicity’s sake, I’m going to define competition as the winner’s margin of victory in 2020 (although this all looks similar if you throw in 2016 data at it).
First stop: the Sun Belt.
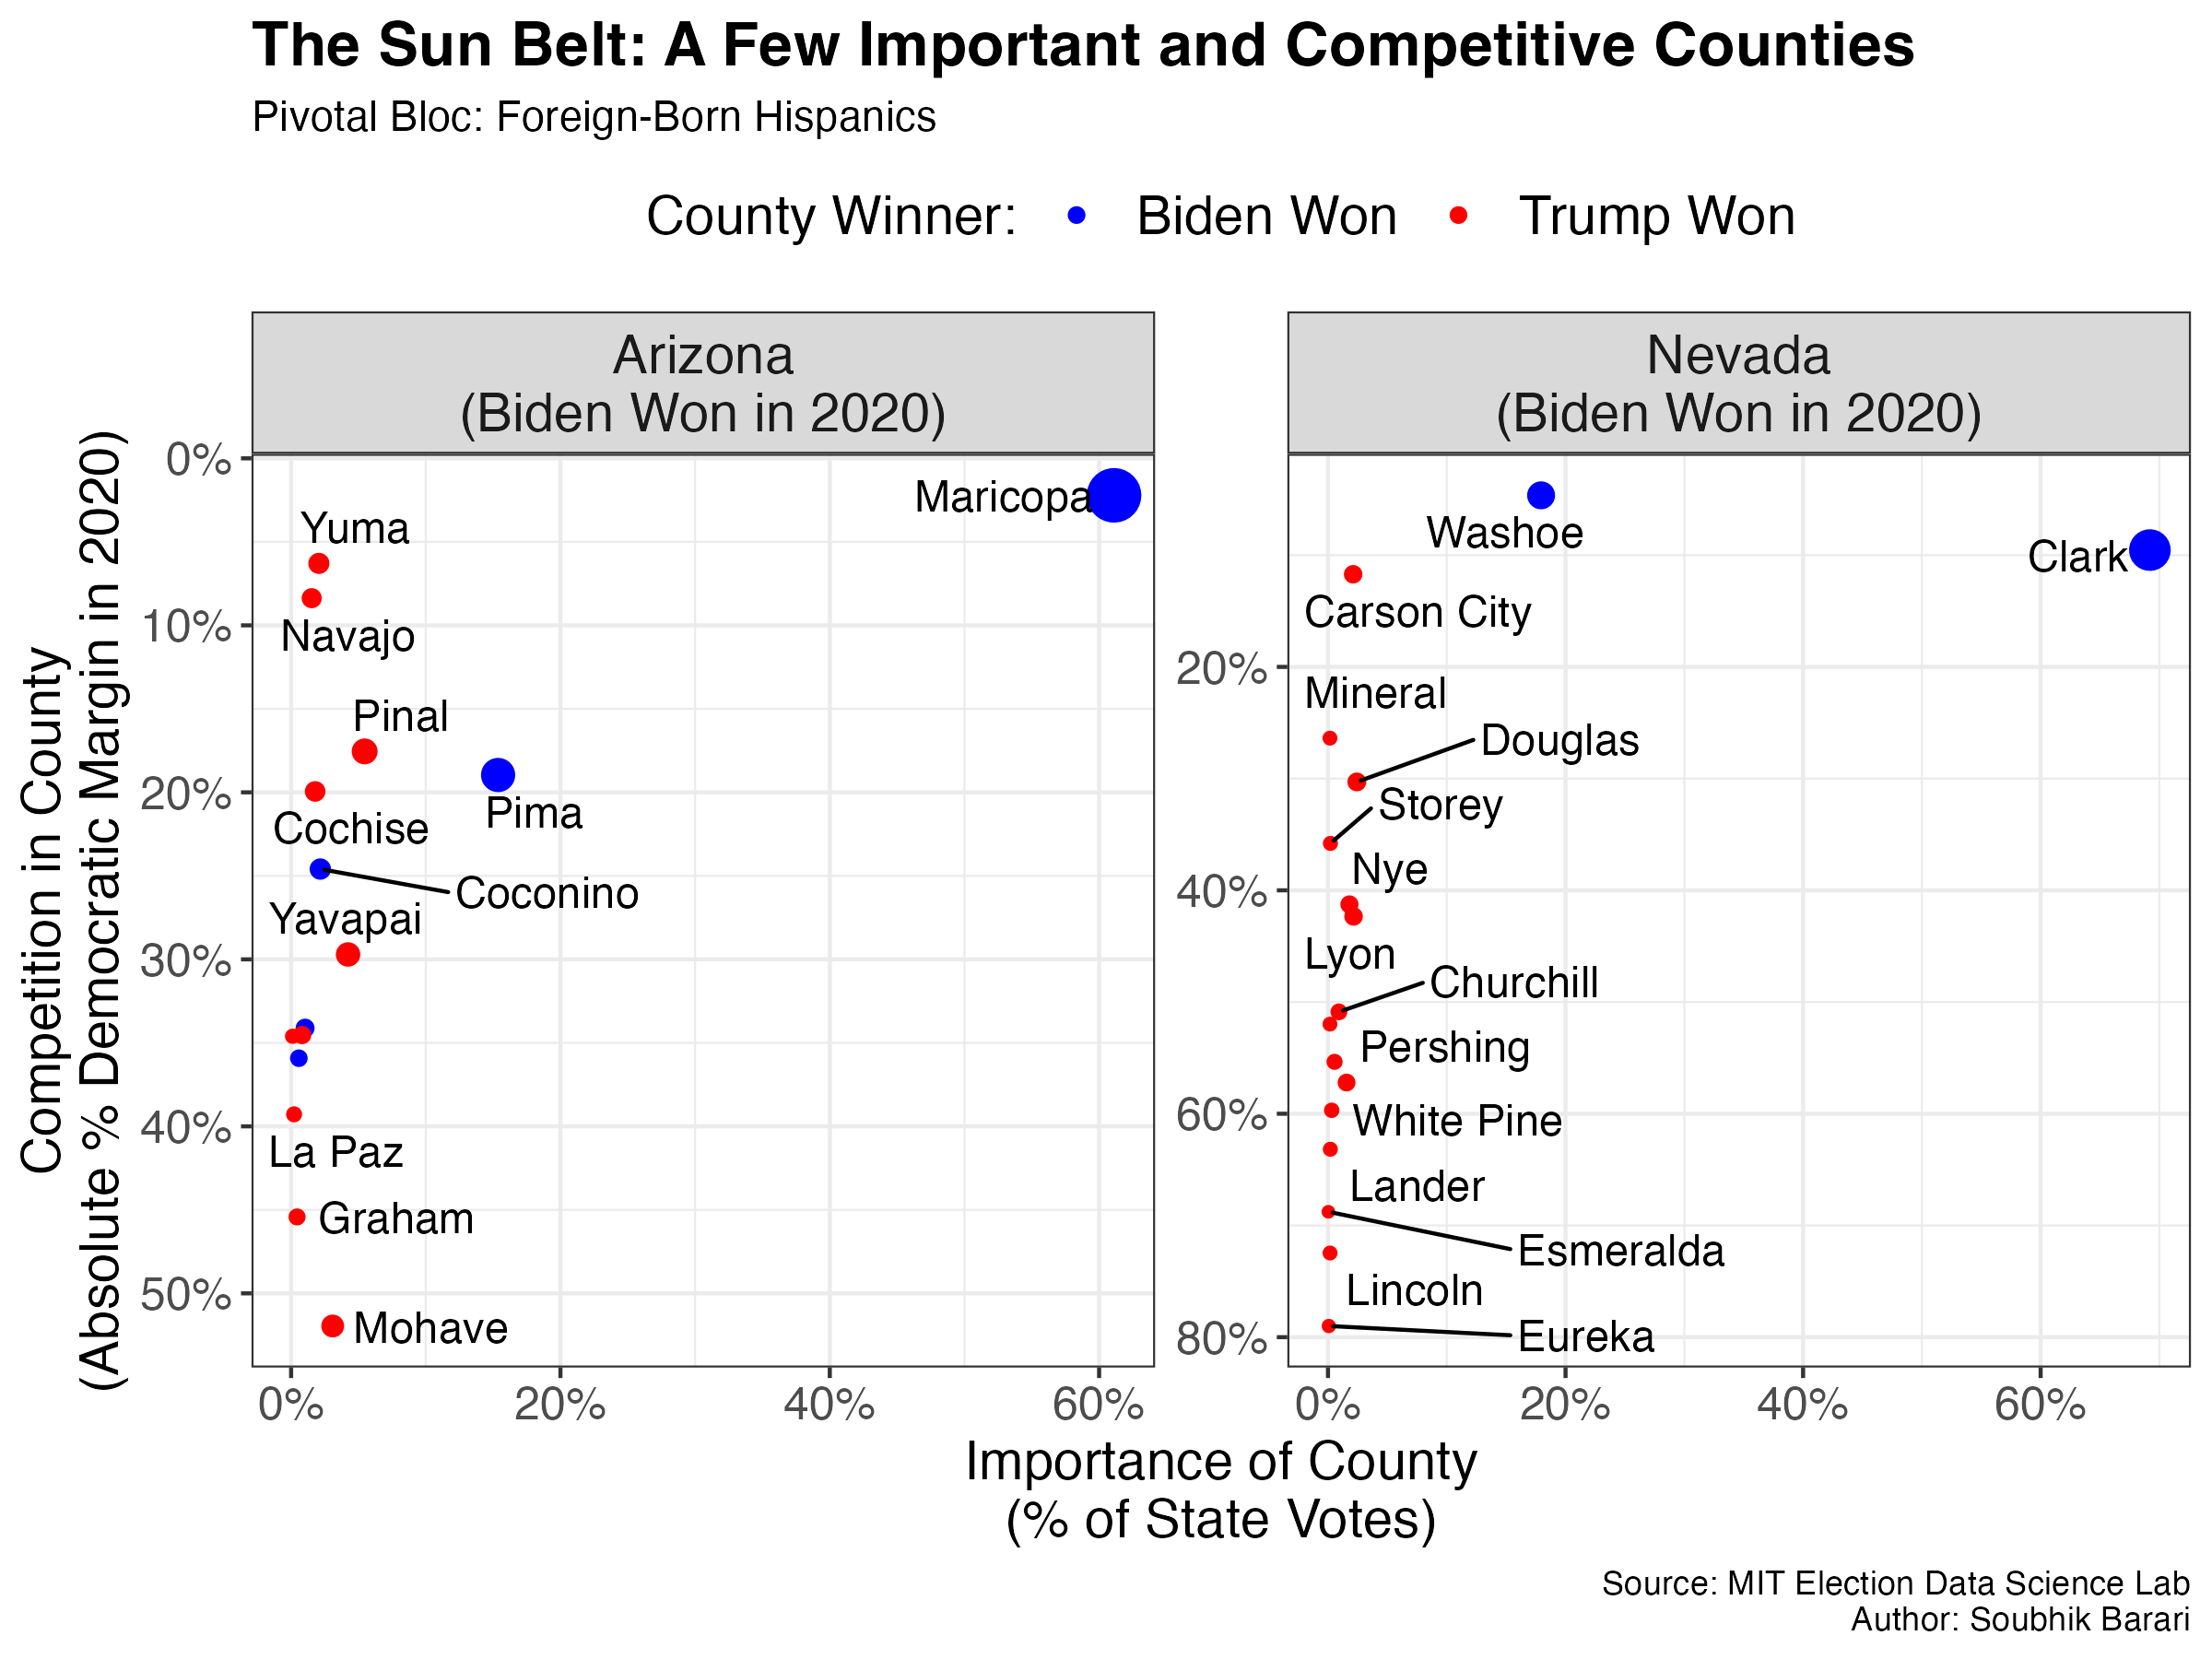
The two Sun Belt battlegrounds give us a beautiful demonstration of this classification, with all of the action in the upper right part of each figure. In each of these two states, the Democratic turnout (which is not high!) in the largest county — Maricopa in AZ and Clark in NV — effectively sealed the deal for Biden in 2020 and will seal the deal for Harris if she can repeat it. Based on demographic counts of residents from American Community Survey, we are talking about turning out a large Latino population (a whopping 32% of residents in Clark county) which includes many foreign-born voters (15% of residents in Maricopa county), possibly voting for the first time.
Moving northward to the Midwest battleground brings us to a different political geography, where there are a few comfortably blue strongholds, a large swath of red counties, and few medium-sized purple-ish-but-mostly-red counties.
The most “close” but meaningfully large counties in Michigan — Saginaw and Eaton — and Wisconsin — Racine, Kenosha, and Winnebago — are demographically dominated by non-college, working or middle-class White residents.

Elsewhere in the Rust Belt, in Pennsylvania, there is a much more interesting arrangement of counties along these dimensions: there are many more competitive and meaningfully large counties (the dots in the middle of the graph).
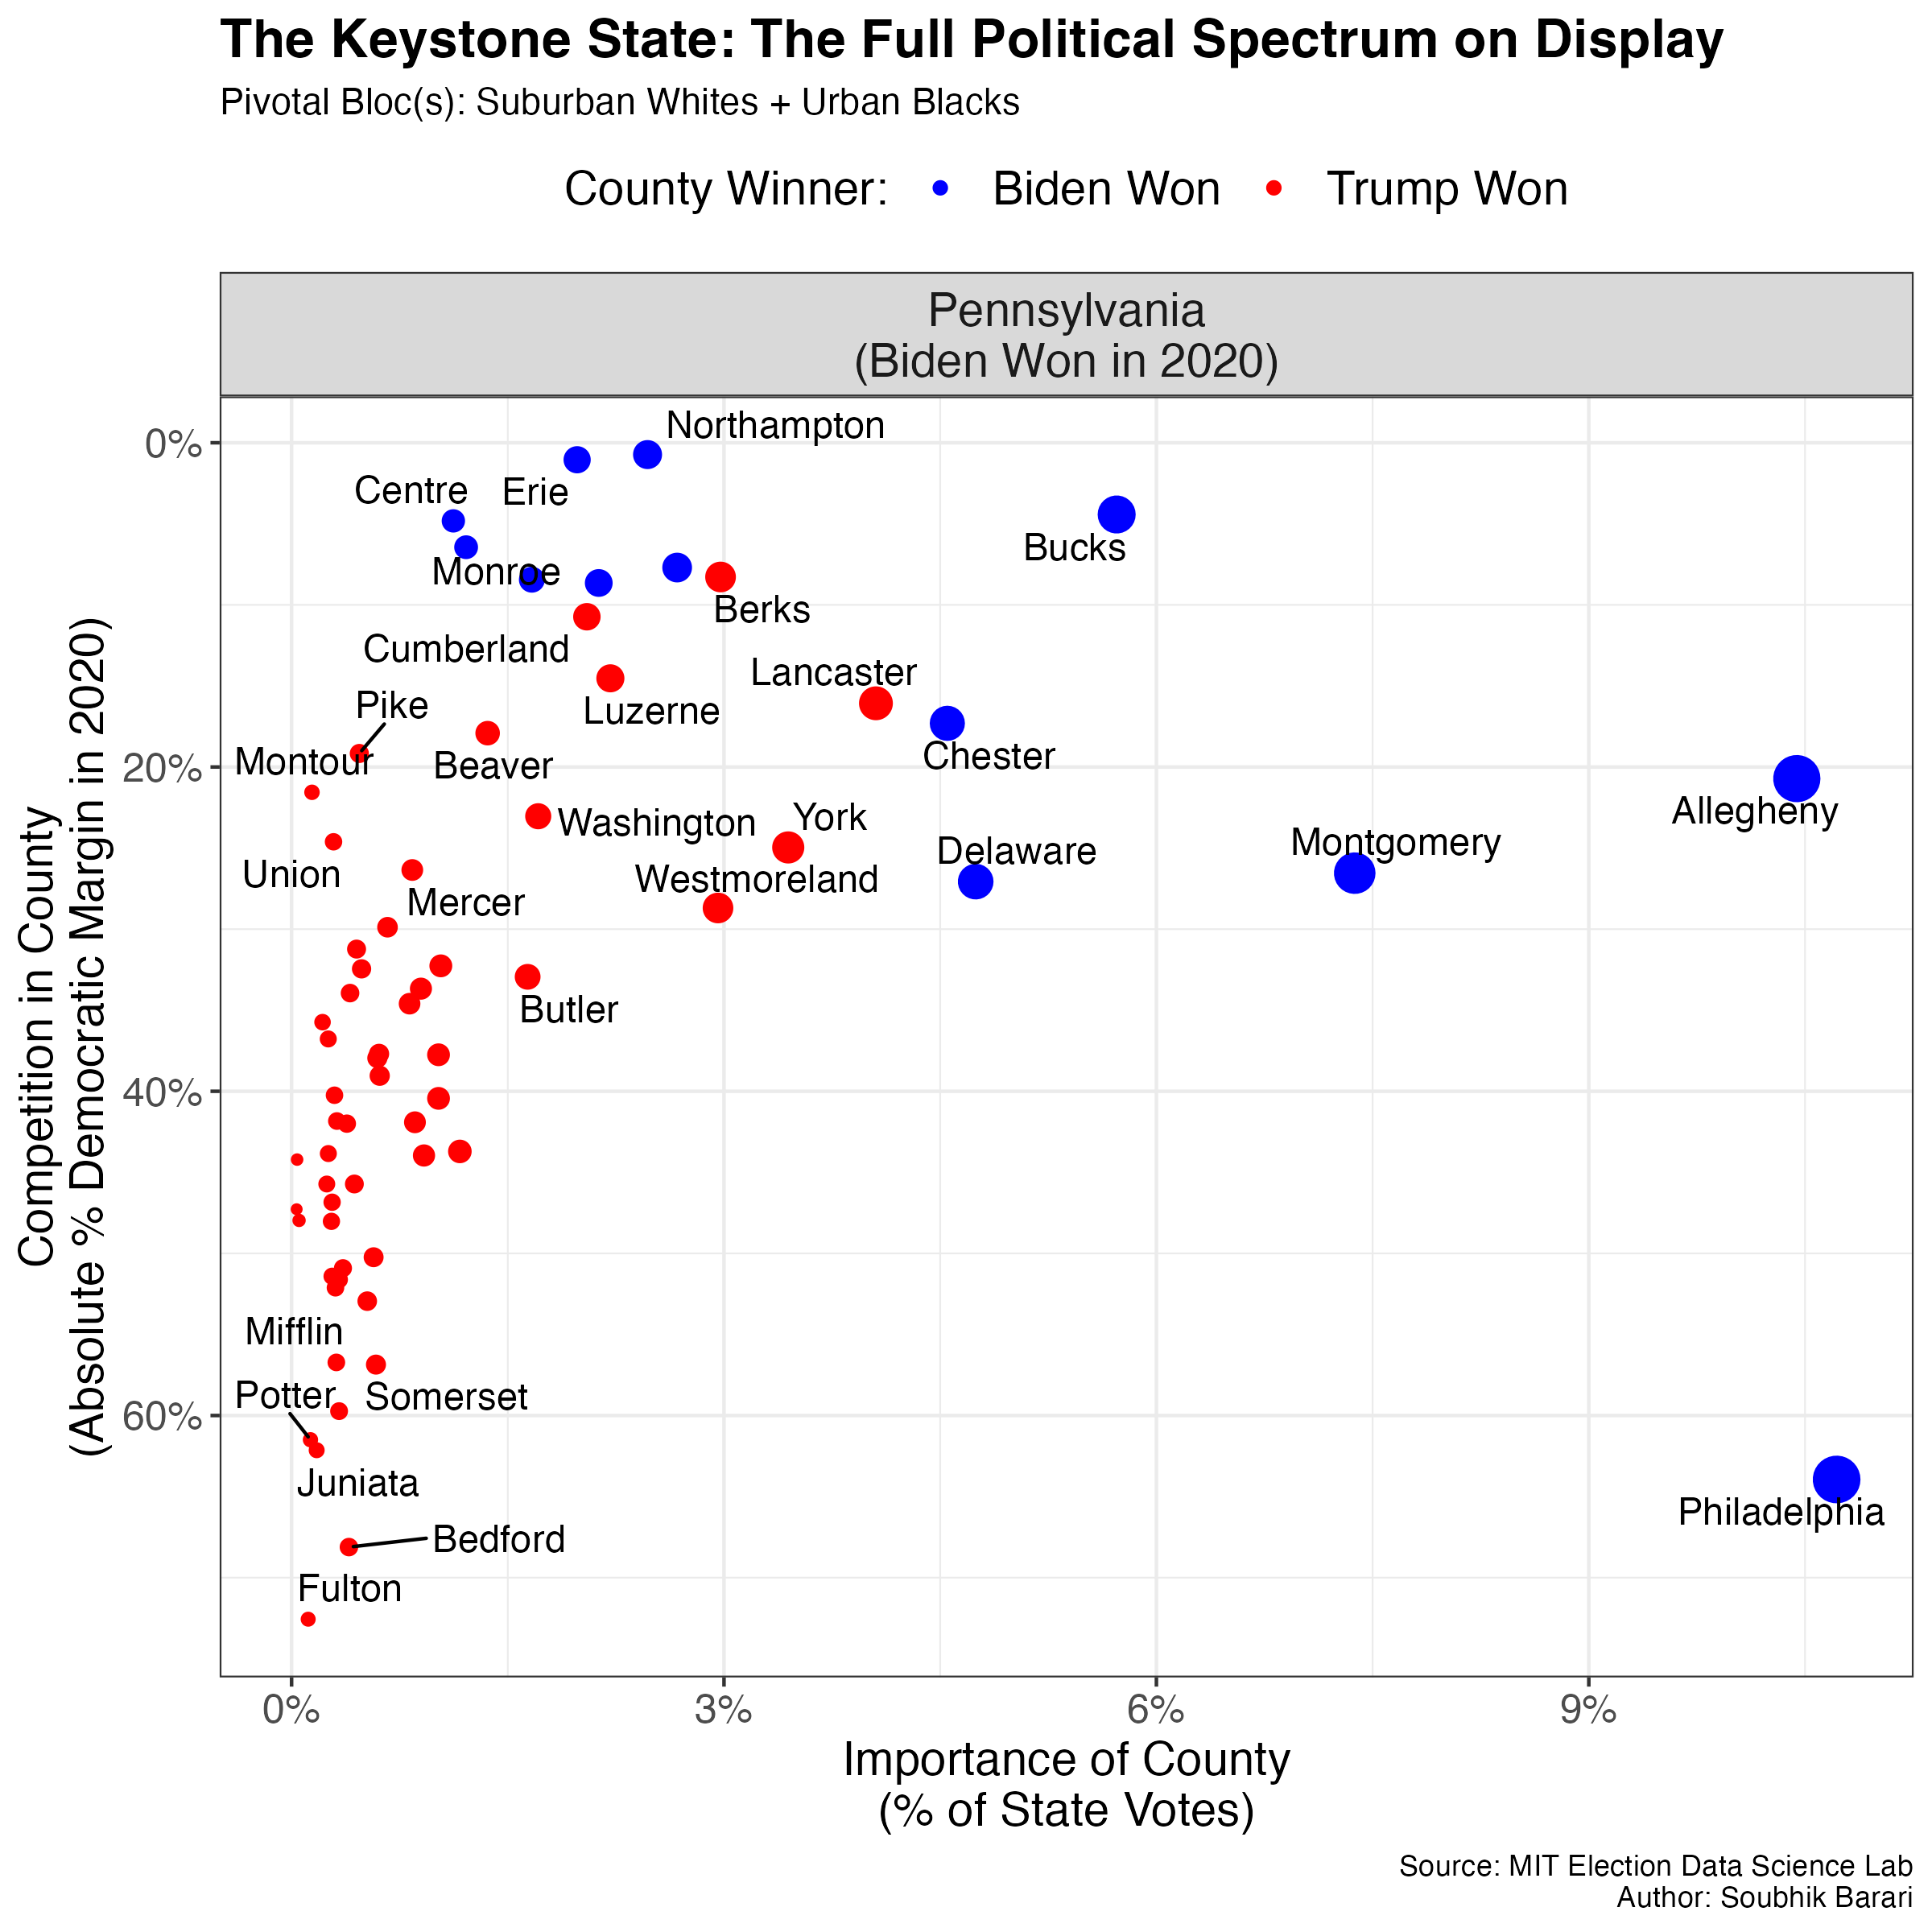
While the razor-thin Biden victories in Erie and Northampton counties are ‘bellwethers’ of his razor-thin 2020 margin in the overall state, PA is arguably all about Bucks County, the simultaneously most important and least guaranteed county in the state. Bucks is characterized by its rapidly suburbanizing, predominantly white population, with a significant portion of foreign-born, middle-class residents. By contrast, Erie County, located on the opposite end of the state, remains a stronghold of working-class white voters. Given the sizeable purple contingent, the turnout of Democrats in Alleghany County and Philadelphia (Black residents making up nearly half of residents in the city) will be crucial insurance for Harris against whatever happens in the rest of the state.
This is a good time for a reminder that once the returns from Philly came back in 2020 — about 48 hours after election night — Decision Desk HQ and all of its partner news organizations declared Biden the winner of the election.
Finally, let’s turn to the Southern battlegrounds (also technically part of the Sun Belt, but for some flavor variety, I’m calling this the “Bible Belt”).
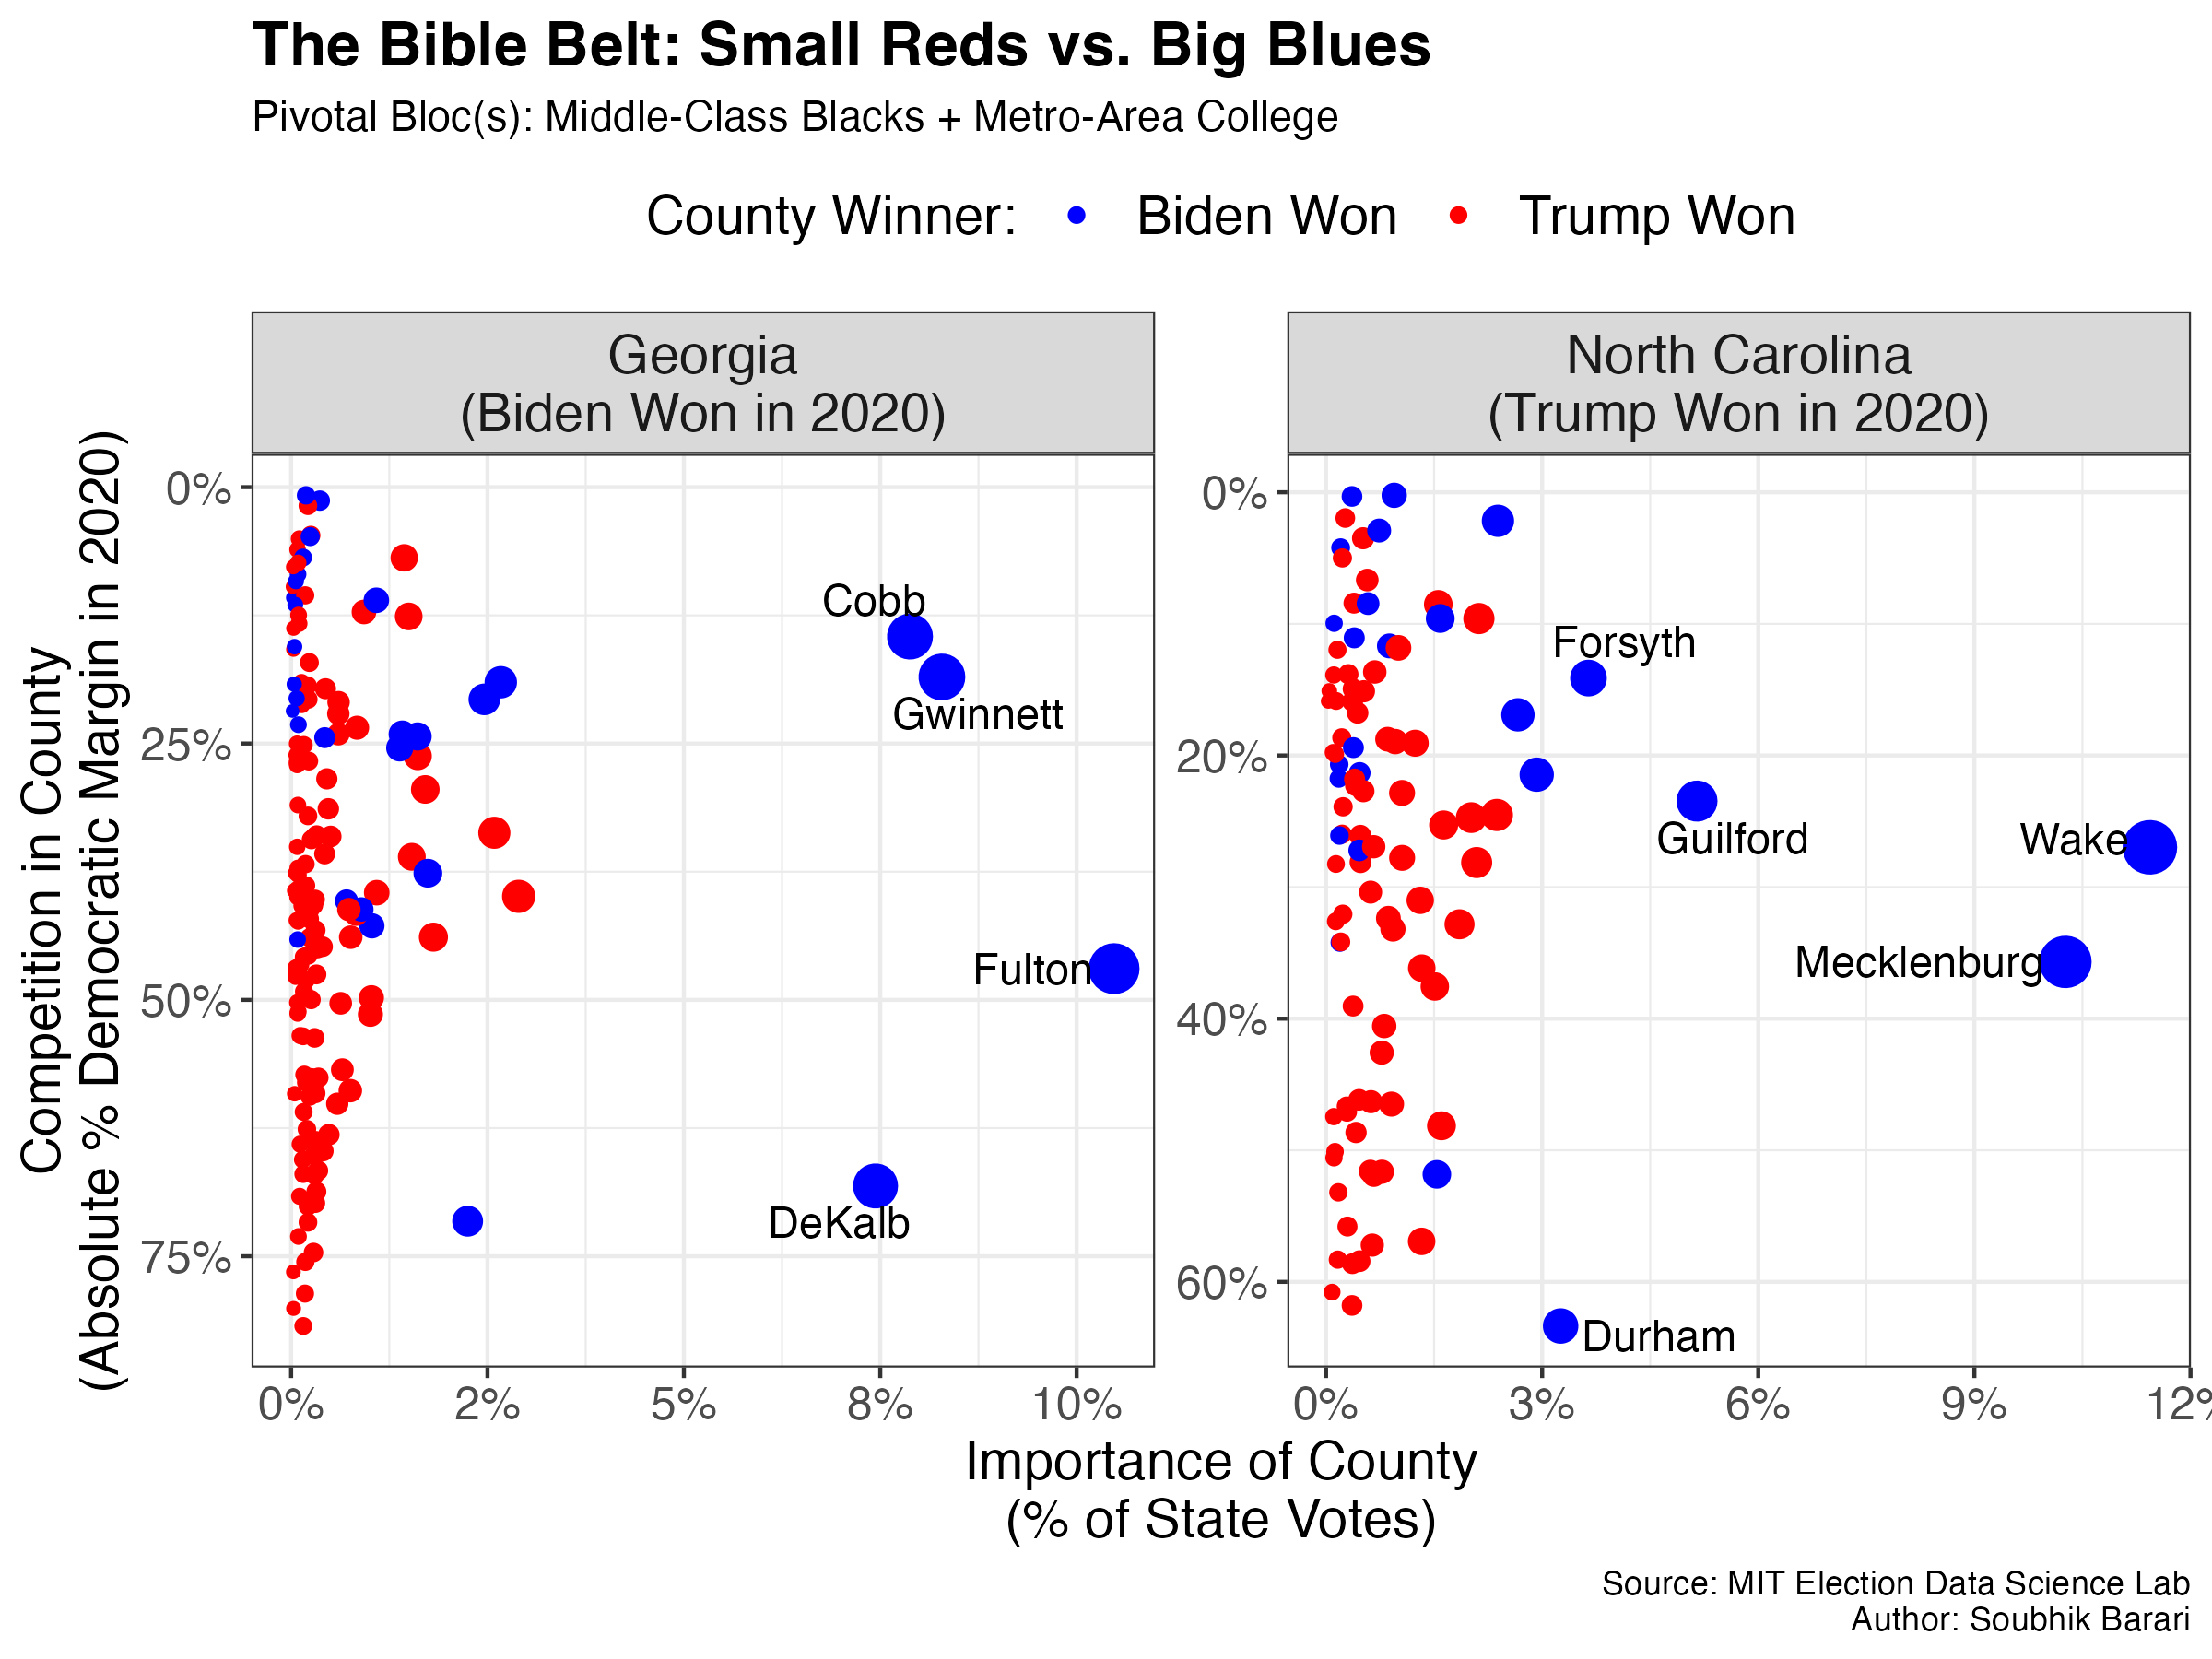
In Georgia, strong Democratic turnout in a few big Atlanta metros won it for Biden in 2020 — most famously, Gwinnett, Cobb, and Fulton counties, officials from whom were subject to protracted allegations of fraud. These are places with an ascendant black middle class, a growing share of college voters, and a relatively young populace relative to the others we’ve discussed.
In North Carolina, there was somewhat of the opposite effect: despite a strong Democrat showing in the counties containing Charlotte and Raleigh and a complete blowout in Durham, there were enough small and medium-sized, strongly Republican counties in the exurbs to cinch Trump a state-wide victory (with a margin of 1.34%).
All told, a familiar patchwork runs across all of America’s presidential battlegrounds: a sea of small red counties offset by a few dense, crucial blue ones. The size of those blues, the number of those reds, and the competing tailwinds for the two candidates blowing across the state (and country) all come together in the final result.
What we can definitively conclude about these three factors is still out of reach. Much of our current knowledge from high-quality polling is in agreement about this: Trump has made inroads with Latino, non-college voters, and younger voters of color, many of whom are to be found in the Sun Belt battlegrounds; Harris is seeing late-breaking gains among older white women, a group somewhat more represented in the Rust Belt battlegrounds. As votes roll in, these and the many other competing theories — about who turns out, where, why, and how that distribution shapes the electoral map — will crystalize.